The National Oceanic and Atmospheric Administration (NOAA) has released the first image taken by Harris Corporation’s Advanced Baseline Imager (ABI) onboard their next-generation weather satellite. The image taken from the Geostationary Operational Environmental Satellite-16 (GOES-16) is of Earth’s full western hemisphere with detailed cloud and water features.
Category Archives: News
Uber Movement
Uber is providing access to anonymized data from over 2 billion trips to help improve urban planning around the world. Uber movement provides a new way on how traffic is moving around in your city. It was designed in partnership with urban planners and transportation professionals. Tools are included to analyze traffic changes over time. Check it out!
Thanks goes to Barry Waite for finding this one!
Five GIS Trends
CHS Cartographic Collection
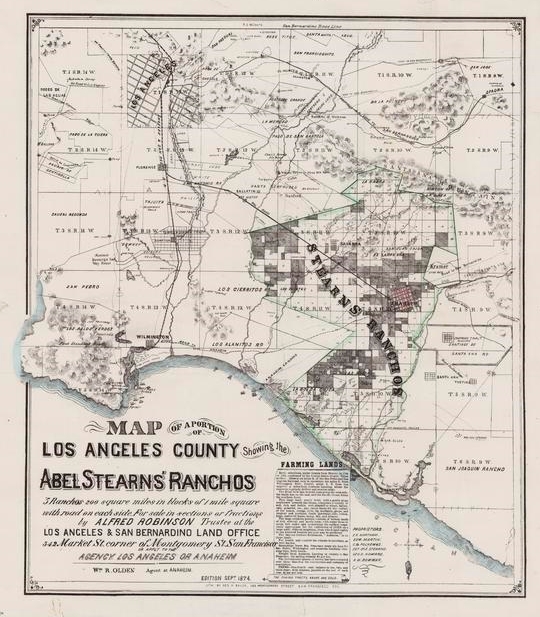
52 19th and early 20th century maps of California have been added to the California Historical Society’s new Digital Library. The images represent a sampling of unique or uncommonly held titles ranging geographically from an 1863 map of the copper region of Del Norte County in the north, to a circa 1866 Topographical Map Showing the Locations of the Sutro Tunnel and the Comstock Lode, to a colorful 1913 townsite map of Date City (now called Calipatria) in Imperial County in the south. In between are city, county, mining, real property, water-supply, road, and railroad maps of various localities throughout the state. Check it out!
Protected Areas Database of the US
The Protected Areas Database of the United States (PADUS) is the official inventory of public parks and other protected open space. With more than 3 billion acres in 150,000 holdings, the spatial data in PAD-US represents public lands held in trust by thousands of national, State and regional/local governments, as well as non-profit conservation organizations.
It is possible to download data for the entire US or a state from the Data page. Data can be downloaded in Shapefile or Geodatabase format. A fact sheet can be found here. To view data in a viewer or download the data click below.
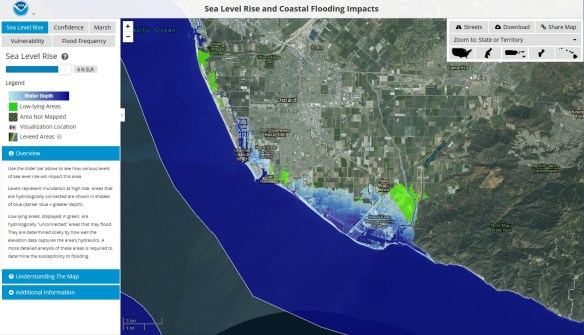
Sea Level Rise Viewer
The NOAA Office for Coastal Management has released a sea level rise viewer. You can use the web mapping tool to visualize community-level impacts from coastal flooding or sea level rise (up to 6 feet above average high tides). You can also download the data used in the app or access the map services. Check it out!
CIA Cartography Division 75th Anniversary
For decades the CIA relied on geographers and cartographers for planning and executing operations around the world. During the 1940’s in support of the military’s efforts in WWII, cartographers pioneered many map production and thematic design techniques, including the construction of 3D map models. To celebrate 75 years of serious cartography, the Central Intelligence Agency has declassified and put decades of once secret maps online. Check it out!
You can read more about it here too.
Drones Flying Free
New Maps Plus Program
Thinking about developing your skills in digital mapping? Then check out University of Kentucky’s New Maps Plus program.
New Maps Plus is a completely online program consisting of three courses (MAP671, MAP672, and MAP673) that focus on online and open source mapping solutions (like QGIS), JavaScript programming, and cartographic design for the web. Students completing the program will earn a Graduate Certificate in Digital Mapping from the UK Geography Department and the College of Arts & Sciences. The courses are taught during 10-week terms that are offered four times a year (see schedule). The next term will be starting January 23rd, with an application deadline of January 8th.
The 2016-17 academic year cost per credit hour is $639.50, plus a $10 per credit hour distance learning fee. Thus the MAP 671 course (3 credits) costs $1948.50 and the MAP 672/673 courses (4 credits) cost $2598 each.
Check it out by clicking below:
Pearl Harbor Attack Map
Today is Pearl Harbor Remembrance Day. On this date 75 years ago, Pearl Harbor was attacked by Japanese forces, leaving over 3,400 casualties and pushing the U.S. to join the Allies in World War II.
National Geographic has an interesting site with an audio/visual timeline tour showing what went down during that day through attack maps. Check it out!