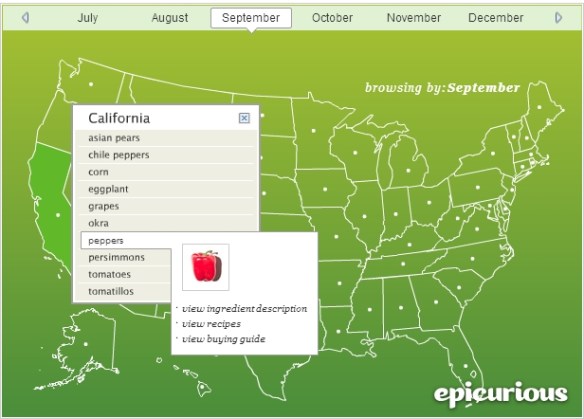
Though just a map of the United States, you can click on a month, then a state to see what ingredients (fruits and vegetables) are in season for that state. They also have links for the ingredient description and buying guide.

Though just a map of the United States, you can click on a month, then a state to see what ingredients (fruits and vegetables) are in season for that state. They also have links for the ingredient description and buying guide.
You might want to check out some of these online geospatial courses as outlined by Directions Magazine.
Selected Open Online Geospatial Courses
| Course | Organization | Next Offering |
| Desktop GIS | Pace University via Blackboard’s OpenEducation | Currently in session |
| From GPS and Google Maps to Spatial Computing | University of Minnesota via Coursera | No future sessions yet scheduled |
| Geodesign: Change your World | Penn State via Coursera | No future sessions yet scheduled |
| Geospatial Intelligence & the Geospatial Revolution | Penn State via Coursera | February 2016 |
| GIS 101, Introduction to Global Information Systems | SkillsCommons | Open, self-paced |
| Go Places with Spatial Analysis | Esri | Currently in session |
| Introduction to Geographical Information Systems | University of West Florida via Canvas Network | Summer 2016 |
| Maps and the Geospatial Revolution | Penn State via Coursera | No future sessions yet scheduled |
| Mobile Devices for Land Management (in Spanish) | UPValencia via edX | No future sessions yet scheduled |
| Open Source GIS | SkillsCommons | Open, self-paced |
| QGIS Courses | GeoAcademy | Open, self-paced |
| Skills for the Digital Earth | Elmhurst College | No future sessions yet scheduled |
| Spatial Analysis | SkillsCommons | Open, self-paced |
| The Location Advantage | Esri | November 2015 |
| Various geospatial courses | Discover Spatial | Open, self-paced |
The California Environmental Protection Agency released a study that identifies areas across California experiencing hotter summer temperatures as a byproduct of urban development.
Urban areas have higher temperatures during summer compared with adjacent rural communities, a phenomenon known as the urban heat island. Heat islands are created by a combination of dark pavement and roofs that absorb heat, heat-generating activities such as engines and generators, and the absence of vegetation that provides evaporative cooling.
While the phenomenon is well-known, the study for the first time creates an Urban Heat Island Index (UHII) to quantify the extent and severity of the heat island effect for individual cities throughout the state. The study found temperature increases ranging from a few degrees in small cities and coastal areas to as much as 19 degrees on average over a day in large, inland urban areas.
Click below to read the report on how the Urban Heat Island Index was created and view the maps and data for different urban areas.

Are you ready for beer? Fall means Oktoberfest celebrations around the globe, and ESRI has created the Oktoberfest Score app that ranks your community against others in the US. The app uses demographic, consumer spending, and market potential data and lets you explore beer consumption in your area and discover other communities with similar tastes. Prost!

The 2015 Western States Wildfires map by the American Red Cross consolidates multiple sources of disaster data into a real-time, interactive tool to get information and updates about the wildfires in the western states. Check it out.

For those of you interested in what went on at the National Geospatial Advisory Committee Meeting on September 1-2 in West Virginia, here is a recap of that meeting.
LA County will be celebrating GIS Day in November and you are invited to attend. For more information, visit their announcement page.
Thanks to all that attended our SoCalGIS meeting yesterday. And thanks to CyberCity 3D for hosting and providing lunch! The presentations by CyberCity, Pasadena, and Emxsys were great too! You can download the presentations on the SoCalGIS Meetings page.
Ready for an epic road trip? Visit every place on this 1962 trip planning map. This map has it all. Originally produced by General Drafting Company, it was one of many produced for oil and gas companies that either freely distributed or sold maps at their service stations.

Here is our agenda for our next SoCalGIS Meeting on September 16th next week:
11:30 – 12:10 Lunch/Meet & Greet
12:10 – 12:20 Welcome
12:20 – 1:45 Presentations
1:45 – 2:00 Wrap Up
Presentations:
1) 3D Geospatial Building Modeling and New 3D Streaming Maps Services, Kevin DeVito, CyberCity 3D, Inc.
2) Using Collector for ArcGIS in the Arroyo Seco, Chandler Sterling, City of Pasadena
3) Using NASA Web World Wind to Predict Wildfire Behavior, Bruce Schubert, Emxsys
PLEASE RSVP if you plan on attending. We need a head count for lunch! Thanks. -mike
