Operation Bird’s Eye

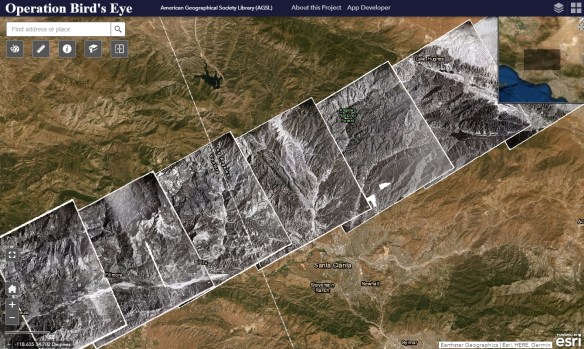
Operation Bird’s Eye is a photographic collection of nearly 400 overlapping aerial images which form a continuous strip spanning the United States from coast to coast. Beginning in Ventura, California and ending over Long Island, New York, these nine by nine inch prints capture a sliver of the American landscape as it looked in 1948. The images were captured during one continuous flight, and when joined together the physical prints stretch 192 feet, showing a slice of land 2,700 miles long.

The flight from which these images were captured took off from the Air Force Flight Test Center (now Edwards Air Force Base) in Muroc, California at 7:40 AM local time on September 1, 1948, first gaining altitude out over the Pacific Ocean before turning east. The plane was a Republic XR-12, an experimental aircraft of which only two were ever built. It was outfitted with K-17 cameras able to shoot a continuous roll of film up to 200 frames. The camera shot at 50 second intervals throughout the duration of the flight, at a constant altitude of 40,000 feet, resulting in a field of vision of around 130 square miles.

The purpose of the XR-12 was photo reconnaissance, and Operation Bird’s Eye was meant as a demonstration of its capabilities. The plane, able to fly high and fast enough to avoid conventional enemy aircraft and fighters, was essentially a flying photography laboratory, with the crew able to process film mid-flight. The Operation Bird’s Eye flight broke records as it crossed the continent, capturing the longest span of aerial photos ever accumulated in a single trip to that point. After 6 hours and 55 minutes, the crew landed at Mitchel Field in Garden City, New York on Long Island.

Click below to read more and check out the images!

operationbirdseye

ArcGIS User Seminar

The ArcGIS User Seminar is a free event that is designed to inspire and guide you to getting the most from your organization’s investment in ArcGIS products. Join ESRI for a full-day seminar with an afternoon workshop. Space is limited in the workshop. ESRI experts will teach users how to become more successful in their work by sharing solutions, reviewing new capabilities, discussing best practices, and building community.

An ArcGIS User Seminar will be offered on February 21 in Glendale.  For more information and to register, click here.

GeoInquiries

Teachers of a variety of subjects and grade levels who would like to incorporate maps into their classroom activities may want to check out ESRI’s GeoInquiries, a collection of short, standards-based inquiry activities for teaching map-based content found in commonly used textbooks. You will find a library of activities organized by topic, with each topic containing 15-20 different activities. Each GeoInquiry activity includes a teachers’ guide in PDF format, an interactive webmap, and an optional worksheet for students. Most activities are Level 1, which are “activities that teach standards-based content without a login to or installation of ArcGIS Online.” Some topics also offer Level 2 activities that use ArcGIS Online analysis tools. Those new to using GeoInquiries should be sure to read through the guide Getting to Know GeoInquiries, which is linked in the introductory paragraph on the collection’s main page. Check it out!

geoinquiries

Atlas of US Historical Geography

Over eighty years after it was originally published, Charles O. Paullin’s Atlas of the Historical Geography of the United States remains one of the most impressive and most useful atlases of American history. Containing nearly 700 individual maps spread across 166 plates, it addresses a broad range of issues. Beginning with a chapter consisting of 33 maps on the natural environment and a second containing 47 maps documenting the evolution of European and later American cartographic knowledge about North America, the atlas mapped an exhaustive number of historical topics: exploration and settlement of the continent, the location of colleges and churches, disputes over international and state boundaries, voting in presidential elections and in Congress, reforms from women’s suffrage to workmen’s compensation, transportation, industries, agriculture, commerce, the distribution of wealth, and military history.  Continue reading

Today: Implementing Open Geography Education Webinar

Open Education Global (OEG), an international network for open education, recently announced Adam Dastrup, Professor of Geosciences at Salt Lake Community College (SLCC), won OEG’s prestigious Open Geography award. In 2014, Adam Dastrup started the Open Geography Education initiative as a way to provide educators with OER textbooks to students. The philosophy of the initiative is to provide open resources, products and services to anybody interested in learning about the earth, its places and the relationships between people and their environments.

In this webinar you will:

  • Learn How the initiative began
  • See Examples of Textbooks
  • Explore implementation

The webinar will be today, Wednesday, January 15th, 2020 11:00 AM- 12:00 PM PST.  Click here to register for the webinar.

Geographic Masking

Geographic masking is a technique used to basically move your data around so not to give away the exact geographic coordinates of individual level data.  This is done when locations of individuals (like in health data, crime data, or endangered species data) need to be “anonymized” so they cannot be re-identified through reverse geocoding.

One tool that does this is MaskMy.XYZ.  MaskMy.XYZ helps users perform a time-tested geographic mask from the scientific literature, known as donut masking. Instead of being a toolbox for a specific (potentially expensive) GIS software suite, MaskMy.XYZ uses popular open source JavaScript libraries to mask data without ever requiring users to install or download any software. So whether you’re a GIS expert who can’t be bothered to script this method yourself, or a GIS newbie who knows you need to mask your data but aren’t quite sure how, MaskMy.XYZ makes your life easier and brings previously cumbersome methods into reach.

Everything runs client-side in your browser, meaning there’s nothing to install, data never leaves your computer, and as a result nobody except you ever sees your confidential files. It is a safe and secure way to anonymize spatial data.  Finally, you can map your secret fishing spots and share them with others without giving away the exact locations!  Check it out!

instructions

GIS at College of the Canyons

Looking to fill a beginning GIS requirement?  Then come join me at College of the Canyons this Spring 2020 semester and sign up for GIS 101, Introduction to Geographic Information Systems.  I promise you the class will be challenging and rewarding!  Also, your earned units are UC/CSU transferable.

GIS 101 is filling up fast, so register for the Spring 2020 semester as soon as possible.  The class is a hybrid class, so there is an online component as well as meeting in person.  The class will meet at the Valencia campus every Tuesday from 6:30pm to 9:35pm, February 11 to June 2.

Feel free to contact me, Michael Carson (michael.carson@canyons.edu), if you have any questions.  More info on the GIS 101 class can be found here.

You Are Being Tracked!

Here is a scary report from New York Times on how our personal locations are being tracked, and mostly from unregulated location data companies that cross reference your location with other databases to figure out who you are, where you live, and where you have been.

“In one case, we observed a change in the regular movements of a Microsoft engineer. He made a visit one Tuesday afternoon to the main Seattle campus of a Microsoft competitor, Amazon. The following month, he started a new job at Amazon. It took minutes to identify him as Ben Broili, a manager now for Amazon Prime Air, a drone delivery service.”

Click below to read the report, and parts 2 to 7!

tracked

Report: California Needs GIS Officer

A government watchdog agency recommended that Gov. Gavin Newsom and the state Legislature create the position of state Geospatial Information Officer to coordinate and advance the use of GIS technology across all departments.

The Little Hoover Commission’s report on geographic information systems technology, called Mapping a Strategy for GIS, follows a study of whether the state government is using GIS to its full capacity and in a cost-efficient manner. The report concludes that overall, the state’s use of GIS is “inconsistent and lacks centralization and coordination.” The 18-page document recommends that the governor and Legislature take three specific steps:

  • Designate a full-time state Geospatial Information Officer
  • Create a GIS Advisory Council, whose members would come from the public sector, the IT industry and nonprofits
  • Use GIS technology to evaluate regional disparities in funding and the delivery of state services.

Click here to read the Techwire article.  Click here to read the report.