Here is an interesting article about mapping the marine environment in the Caribbean. Check it out!
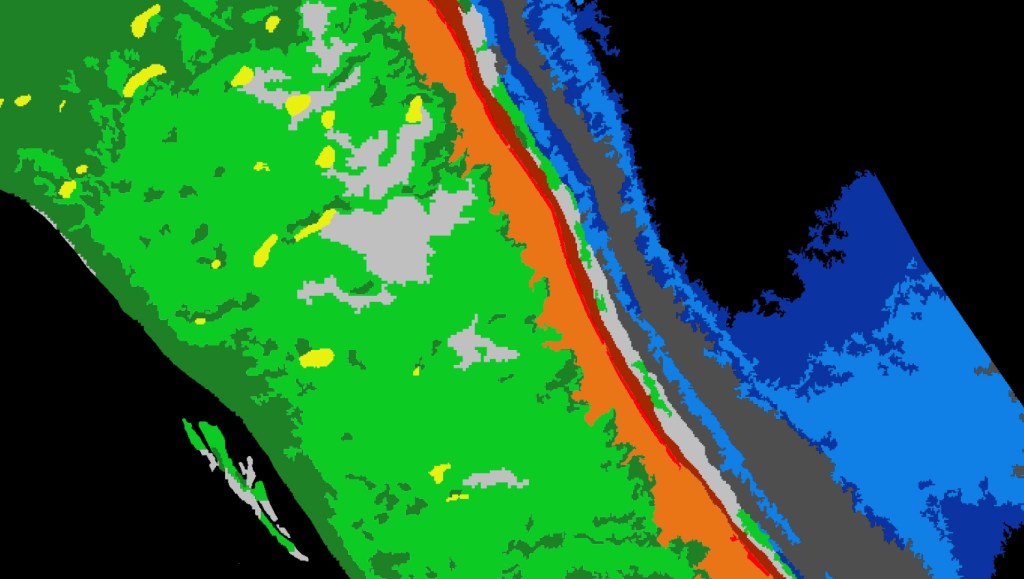

Here is an interesting article about mapping the marine environment in the Caribbean. Check it out!
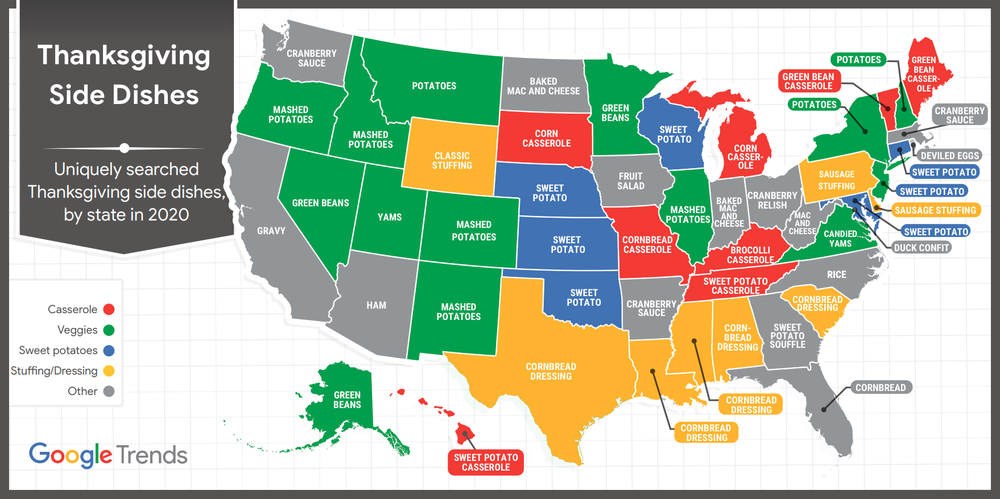
This year’s Thanksgiving map is from Google looking at uniquely searched side dishes in each state this year. Gravy seems to be the thing in California. Mac and Cheese in West Virginia! Cornbread dressing in the South … what is that? Happy Thanksgiving!
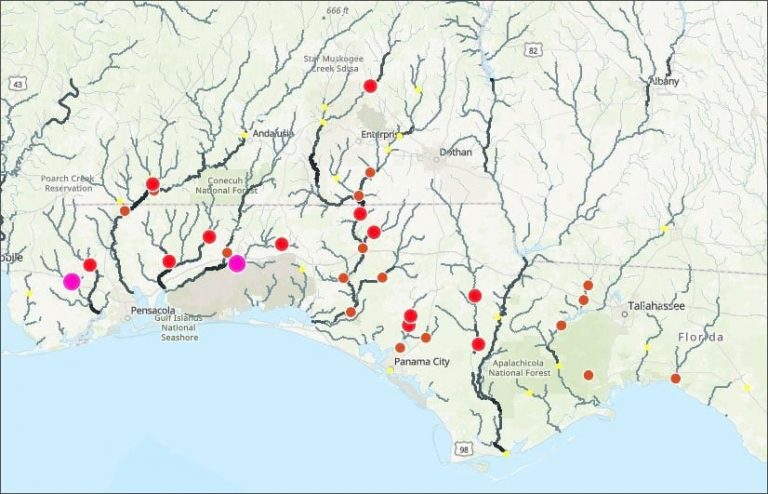
According to NOAA, flooding is the major threat for inland populations. Flash flooding can occur quickly due to intense rainfall, often accumulating from some distance away from where the flooding occurs. Flooding along rivers and streams can last for many days after a storm has passed. See how you can use ArcGIS Online and ArcGIS Living Atlas to make a flood map in no time at all.
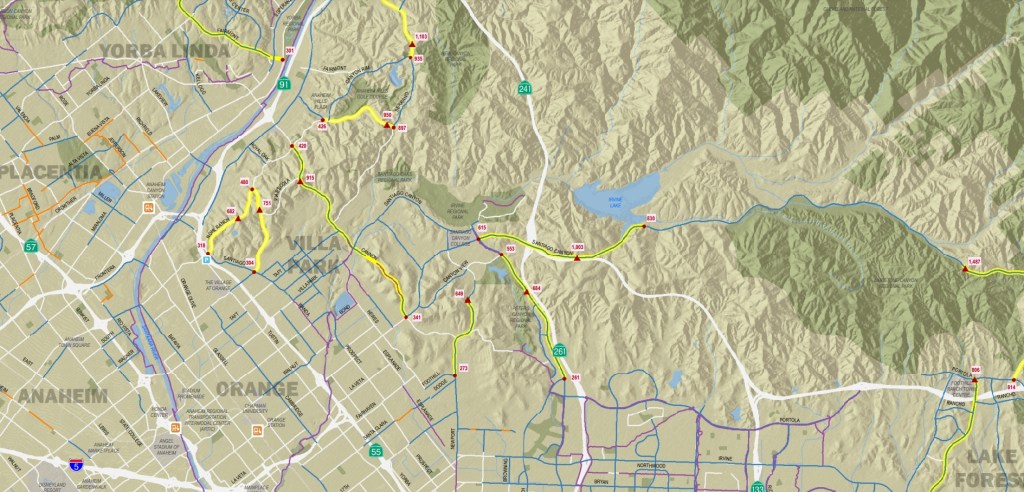
An updated Orange County Bikeways Map, which rates paths by steepness of grade and other features, is available on the Orange County Transportation Authority website. Check it out!
GIS Day 2020 is here. Most of us are probably celebrating virtually this year. Check out what is going on at LA County, they have a great lineup.
And if you have something going on, just post a comment below and links to your event.
Also ESRI has a nice map showing where GIS Day events are going on.

Happy GIS Day!
The Library of Congress is having a conference tomorrow, and since it will be virtual for GIS Day, anyone can attend! The Geography and Map Division is bringing together a panel of experts, on Wednesday Nov 18th, who are at the forefront of using GIS to track and fight the spread of SARS-CoV-2, the virus that causes COVID-19.
Mapping a Pandemic: Cases, Traces and Mutations, will take place tomorrow in honor of GIS Day 2020 and National Geography Week.
Experts from Johns Hopkins University and ESRI will be joining to discuss the geospatial and genomic data being used to understand the pandemic and examine how mapping and GIS technologies are helping public health officials, emergency rooms, epidemiologists and the public grasp the spread of the disease and decide on allocation and distribution of precious resources, like vaccines.
For epidemiologists, studying the virus and its evolution and mutations, not to mention thinking about the distribution of potential vaccines, the pandemic has inspired widespread use of GIS, and new geospatial machine and deep learning technologies. Scientists and public health officials are relying on these new mapping and computational methods to understand the viruses spread and on new visualization techniques developed by cartographers to track the geospatial dynamics of its mutations.
Speakers are:
Keynote:
Dr. Este Geraghty, Chief Medical Officer at ESRI
The Role of GIS in Fighting the SARS-CoV-2 Pandemic
Technical Papers:
Ensheng Dong, Center for System Science & Engineering, Johns Hopkins University
Historic First: Mapping the Pandemic in Real Time
Mike Schoelen, ESRI Health and Human Services
Driven by GIS: A Resilient Supply Chain for COVID-19
John Hessler, Library of Congress & Johns Hopkins University
More Than Just Cases: Mapping the Mutations of SARS-CoV-2
These presentations will premiere on Nov 18, at 1 PM EST (10 AM PST), with closed captions on both the Library’s YouTube site at https://www.youtube.com/loc/ and on the Library of Congress website at https://www.loc.gov/collections/event-videos/. The presentation will be available for viewing afterwards at those sites.
For more information see the Library of Congress Events Calendar or Press Release below:
https://www.loc.gov/item/event-400264/gis-day-2020-mapping-the-pandemic/2020-11-18/
Update 12/7/2020: The conference recordings can be found here.
Join the ESRI water team for a few hours of GIS-focused conversation. Don’t miss this opportunity to learn from like-minded peers facing common challenges in the water industry. Learn how GIS is being used in the following organizations:
The agenda will also include a presentation from the ESRI water team. Find out what’s new with ESRI technology.
Don’t miss your chance to participate in this virtual user group meeting on November 19th. Click below to register.

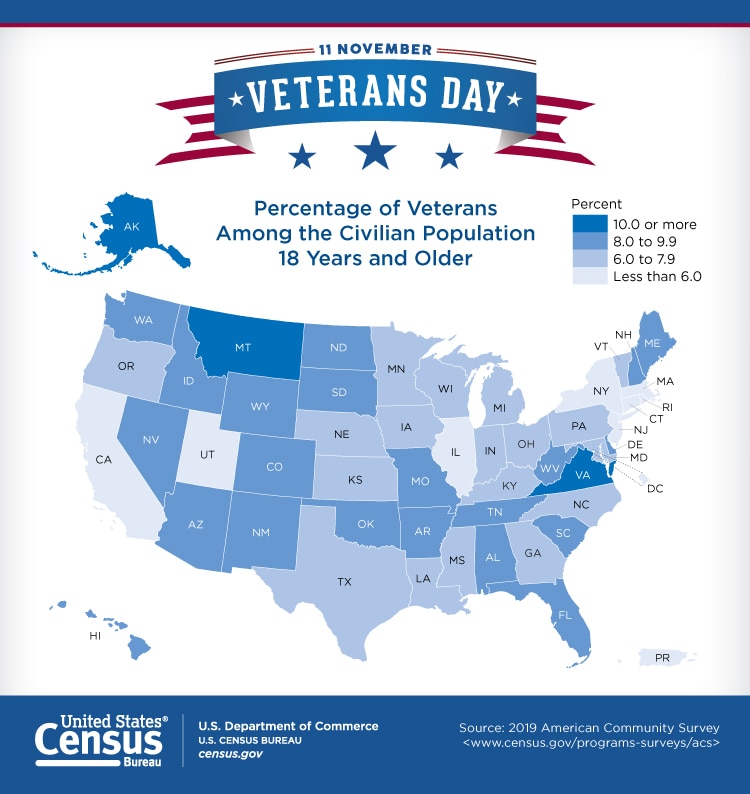
To celebrate Veteran’s day, here is a map from the US Census Bureau showing the percentage of veterans among the civilian population 18 years and older.
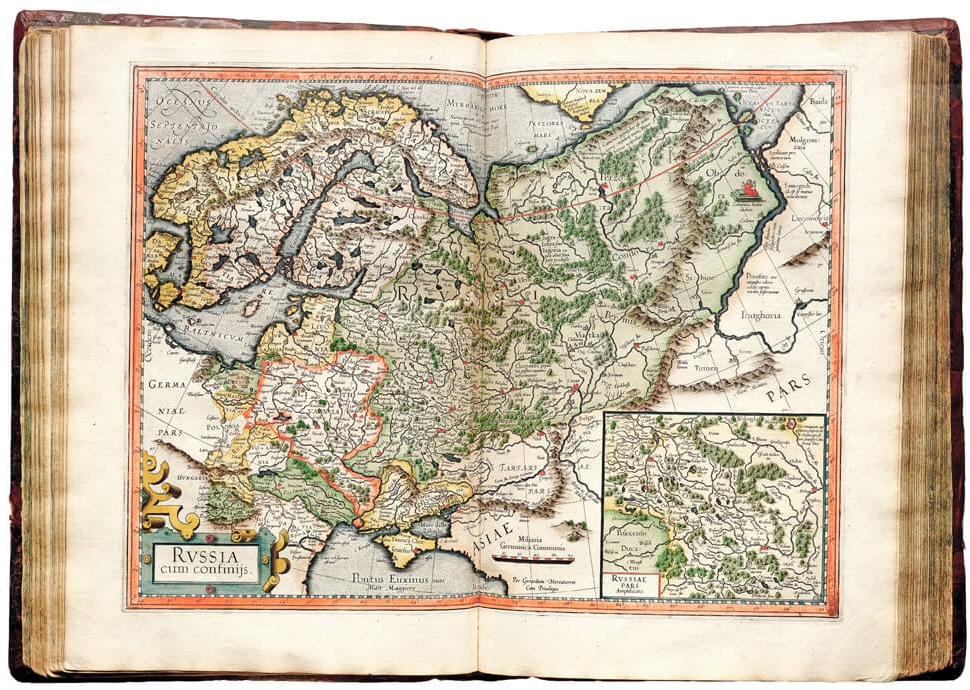
Geographical maps are a mirror of what we know about the world around us. Few individuals contributed more to the map making field than cartographer Gerardus Mercator. Check out this site that examines Mercator’s map making breakthroughs and mistakes, while also recognizing his lasting legacy. We still use Mercator’s projection for making nautical and aeronautical charts!
Since this is Election Day, I thought I would find something on election maps and cartography. I found this article from the New York Times. Politics aside, they do show how you can make a better election map using cartographic and color techniques. Check it out!

Also check out this interesting historical map at the Library of Congress on Presidential Elections from Washington (1789) up to Hayes (1876). Some of the history of the elections on the map are very interesting:
“Disputes arising in February, over the votes of South Carolina, Florida, Louisiana and Oregon, they were referred to, and decided by a Commission appointed for that purpose.”
“The votes of Arkansas and Louisiana were not counted in February, on account of irregularities.”
“Objections made to Wisconsin’s vote in February, were overruled by the Vice-President.”
Click below to see the map in detail.

