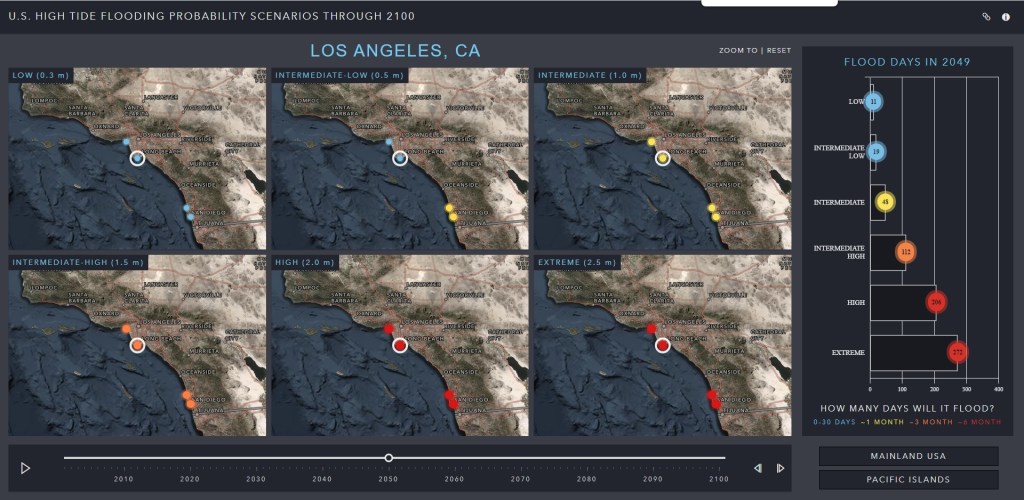
High tide flooding today mostly affects low-lying and exposed assets or infrastructure, such as roads, harbors, beaches, public storm-, waste- and fresh-water systems and private and commercial properties. High tide flooding is likely more disruptive (a nuisance) than damaging. The cumulative effects, however, are becoming a serious problem in several coastal locations.
See where high tide flooding is probable over the next 80 years and how many flood days are expected annually with the High Tide Flooding app using NOAA study data.
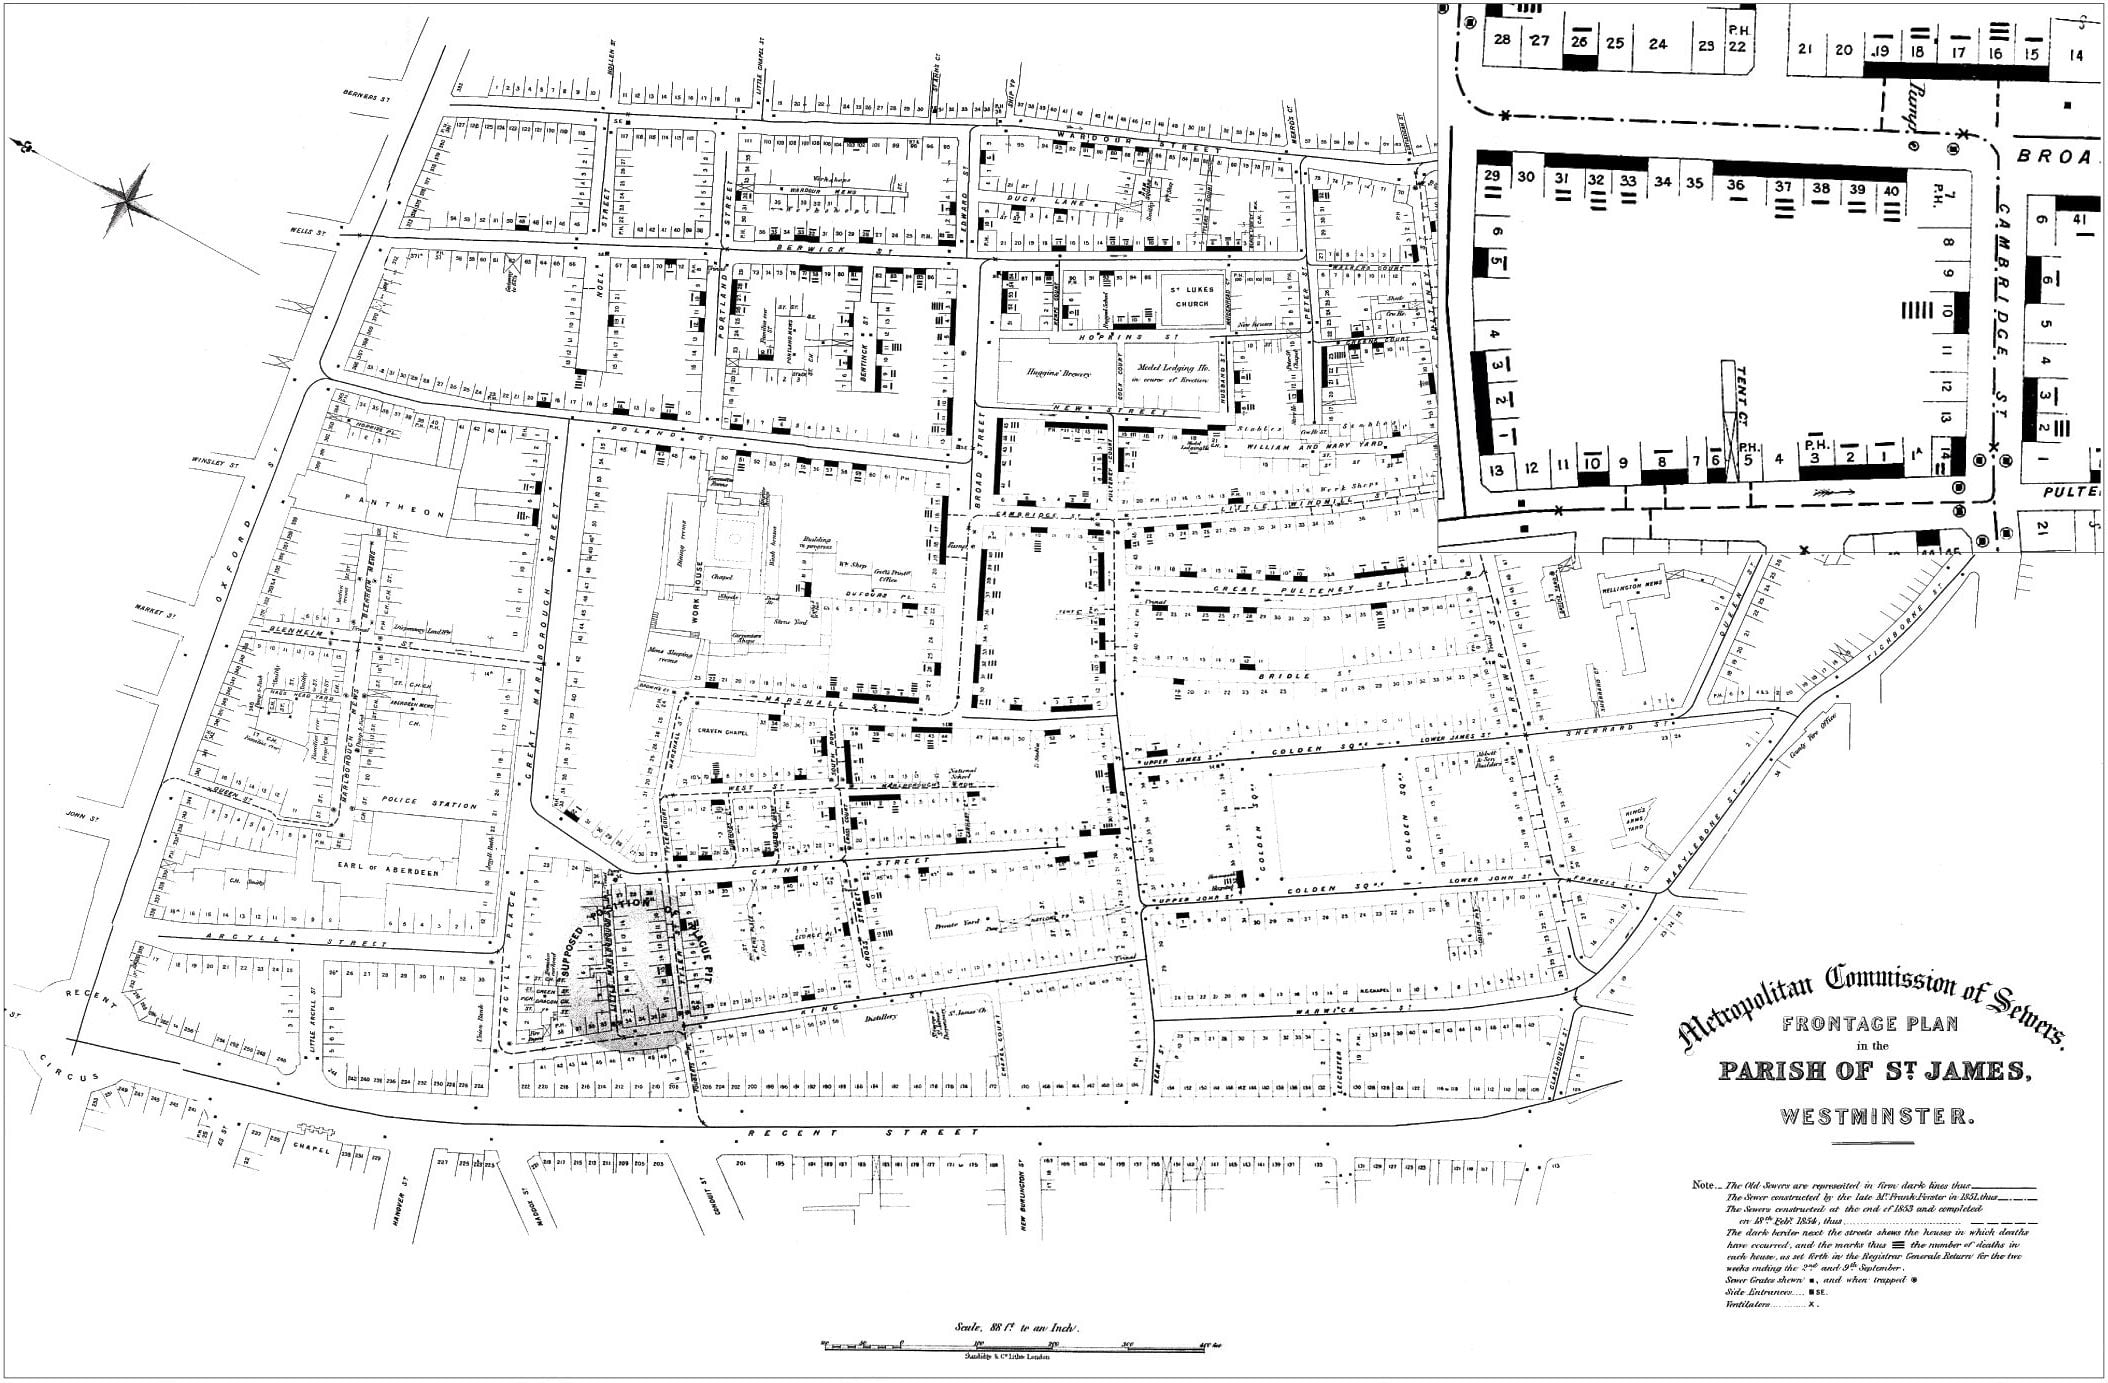
Most of you that took Geography, Cartography, or GIS courses remember reading about the story of Dr. John Snow and his map showing the cholera outbreak in Soho, London in 1854.
You also probably remember how he plotted cholera cases on the map and how he used that information to figure out that there was a strong spatial relationship between the cases and a polluted well on Broad Street, so he had the pump removed and the outbreak stopped. The map has been used as an example of the principles of GIS using layers of information and spatial relationships.
Well … despite it being a great story, unfortunately it’s not really how it played out. Both the use of the famous map and the story surrounding it have become somewhat modified through the passage of time. Click below to read the mythology of Snow’s cholera map.
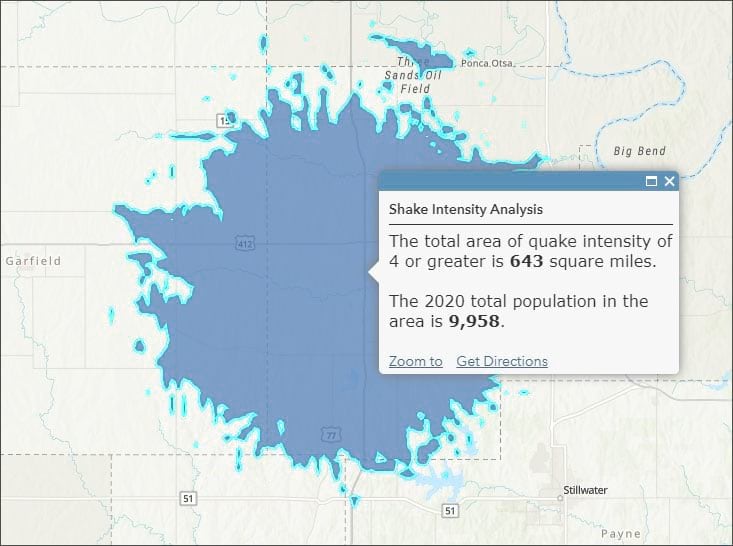
Check out this interesting post about using ArcGIS Online and the Living Atlas data to find 2020 population statistics that fall in a recent earthquake shake intensity area.
The talk will take place Friday, April 23, 2021 on Zoom.
On the event of the fifth anniversary of the David Rumsey Map Center at Stanford University, please join us for an online talk by special guest Dr. Joshua Miele who will talk about his story as a blind cartographer.
Joshua will use the creation of TMAP – Tactile Maps Automated Production – to frame the broader landscape of how tactile maps and graphics can be used by blind people to understand many kinds of spatial information. He will discuss the power of touch as a spatial percept, as well as the design constraints on tactile representations that are surprising and challenging to most visual designers. Key topics include historical techniques for creating tactile maps, examples and counterexamples of tactile map use cases, and promising technologies for expanding the availability of accessible maps in the future.
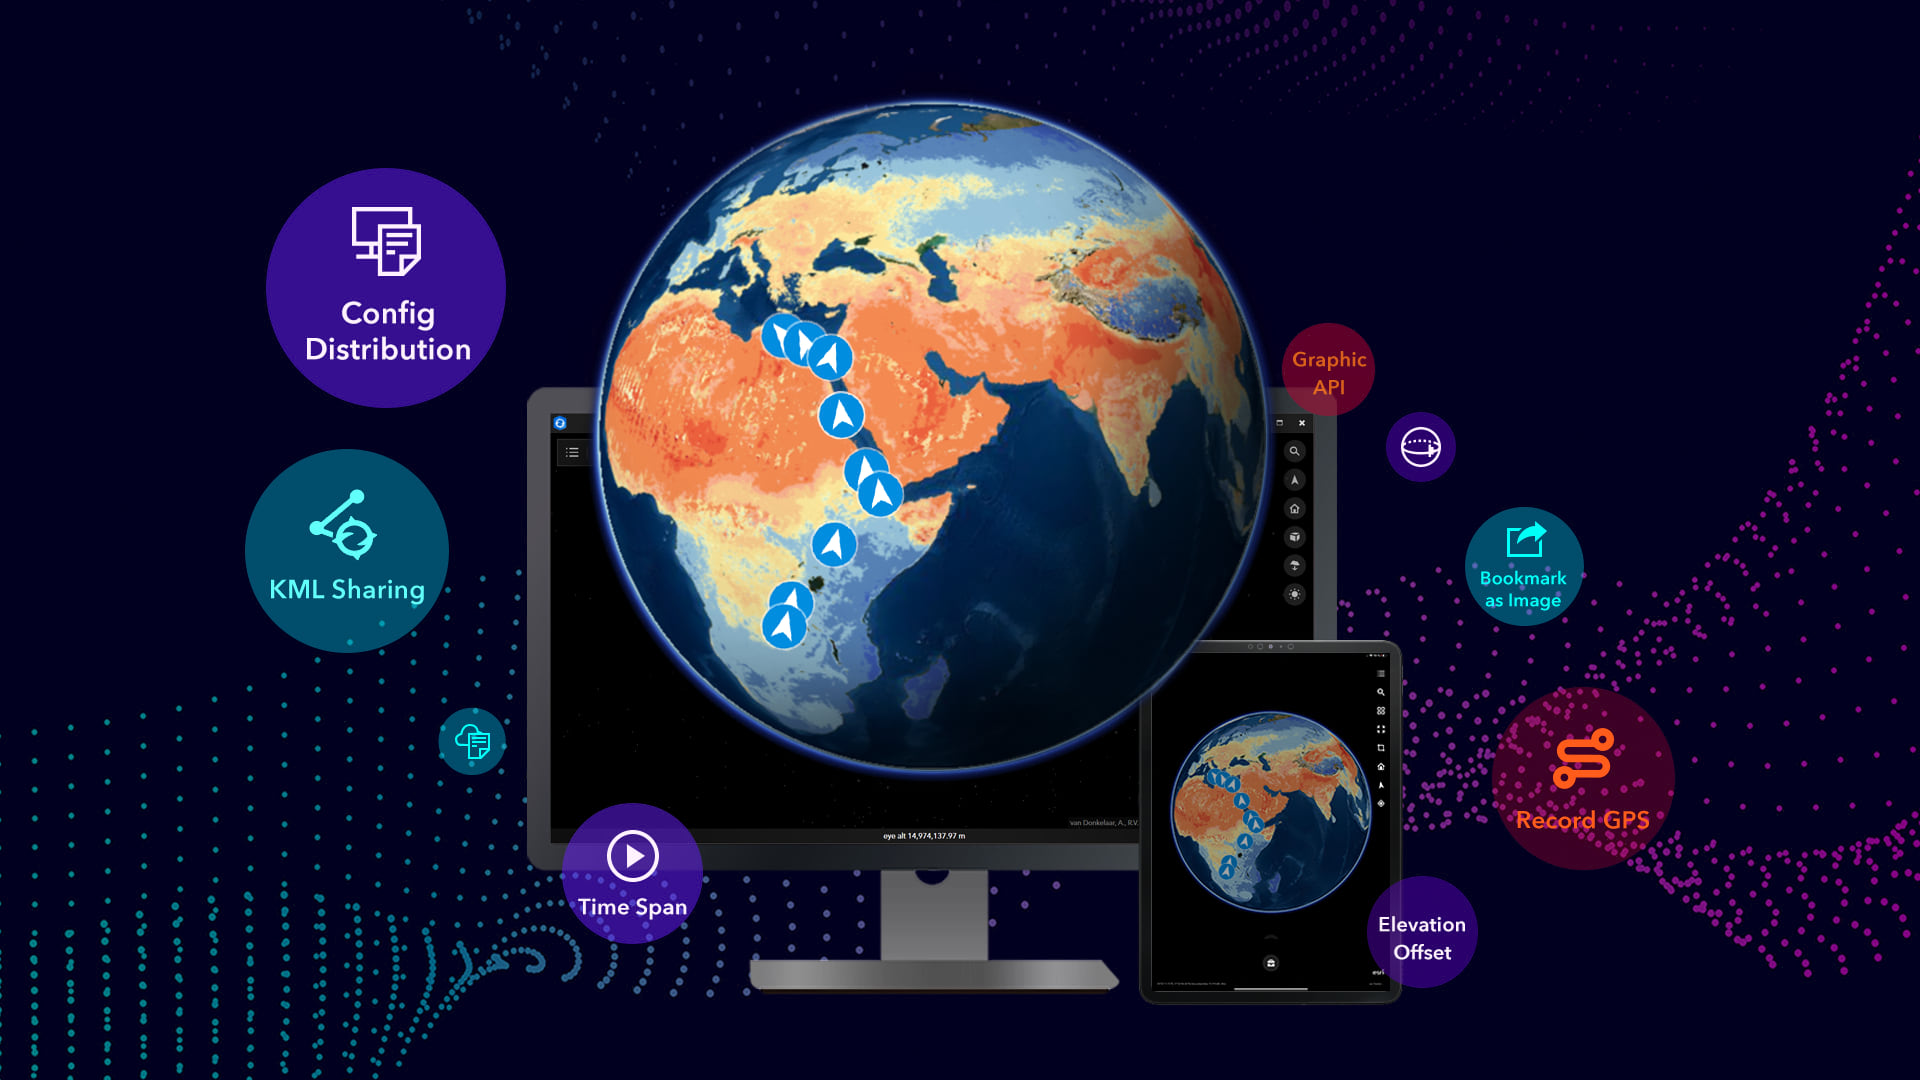
There is a new release of ArcGIS Earth. This is a major release for ArcGIS Earth on desktop, bringing users more capabilities for sharing data as well as configuration settings–from mobile, to desktop, to the organization portal. Mobile users will also get a new release of the ArcGIS Earth app later this month. Click below to read more.
The USDA National Aerial Imagery Program (NAIP) has 2020 California aerial imagery services available. Also provided are services for earlier NAIP years and links to source data downloads and related files containing specific imagery dates. Click below for more info and links to the image services.
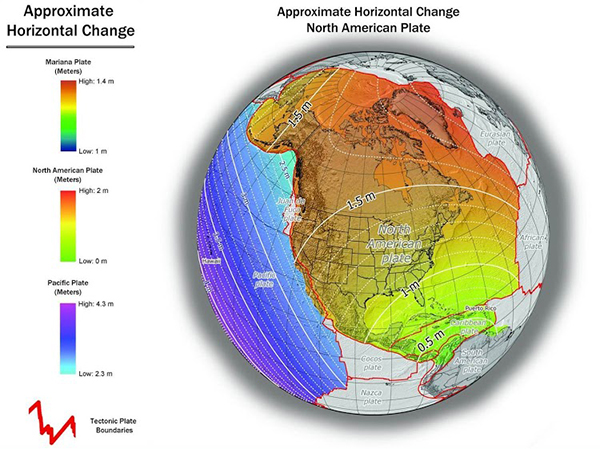
Registration is open for the next National Geodetic Survey (NGS) Geospatial Summit, taking place online on May 4-5, 2021, from 1:00 – 5:00 pm, ET. NGS strongly encourages attendees to participate on both days.
The NGS plans to replace the North American Datum of 1983 (NAD 83) and the North American Vertical Datum of 1988 (NAVD 88) as part of modernizing the National Spatial Reference System (NSRS).
Attend this year’s Geospatial Summit to:
Learn the benefits of NSRS modernization,
Hear about NSRS modernization progress,
Prepare for how the transition will affect you,
Ask questions of NGS experts, and
Share your feedback about the planned changes.
The summit is free for everyone to attend. Click below for more info and to register.
UPDATE 4/15/2021: The recorded webinar can be watched here.
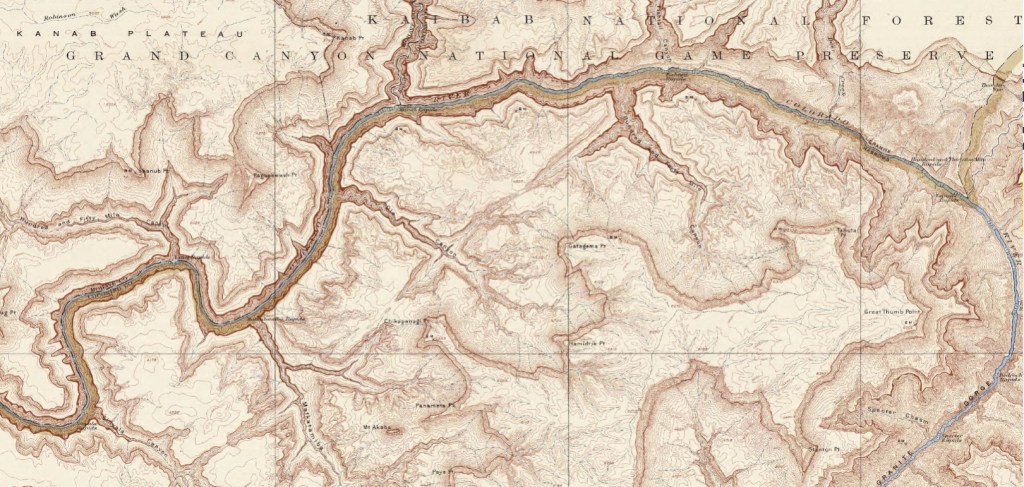
For those of you that like historical cartography and the Grand Canyon, you might find this online lecture very interesting.
2021 “Maps & America” Arthur Holzheimer Lecture: “Mapping Grand Canyon National Park” April 8 @ 4:00 PM – 5:00 PM PDT
Tom Patterson, US National Park Service Cartographer (Ret.) Mapping Grand Canyon National Park
Tom Patterson, US National Park Service Cartographer (Ret.), will present a virtual talk, “Mapping Grand Canyon National Park,” on Thursday, April 8, 2021 at 4 pm PDT.
Patterson’s presentation will focus on four recently published maps of Grand Canyon National Park that owe their design inspiration to renowned mapmakers of the twentieth century.
This will be the 31st annual Maps & America lecture, supported by an endowment created by Arthur and Janet Holzheimer.
The lecture series was inaugurated by the noted cartographic historian, Brian Harley, in 1990. Over the years, the series has featured many of the leading figures in the field of map history and provided a multifaceted survey of this rapidly developing field. A list of previous speakers can be viewed here.
Did you remember to register for the 2021 ESRI User Conference? To be honest, I completely forgot about it!
The conference will be online again. Registration is open. It is free to all to attend the Plenary Sessions only. Those maintaining ArcGIS software maintenance will have access to all content. Click below for more info and to register.
The California GIS Council has started a quarterly CA GIS legislation update for the wider California GIS community. They call it “GIS Under the Dome”. Below is a link to the latest edition.