After you view the Halloween Candy Map, check out this one showing the craziest urban legends from each state!


After you view the Halloween Candy Map, check out this one showing the craziest urban legends from each state!
Interesting map showing each state’s favorite Halloween candy. The online survey was conducted in September with a total of 42,238 users. The candy that polled the highest was Reese’s Peanut Butter Cup.

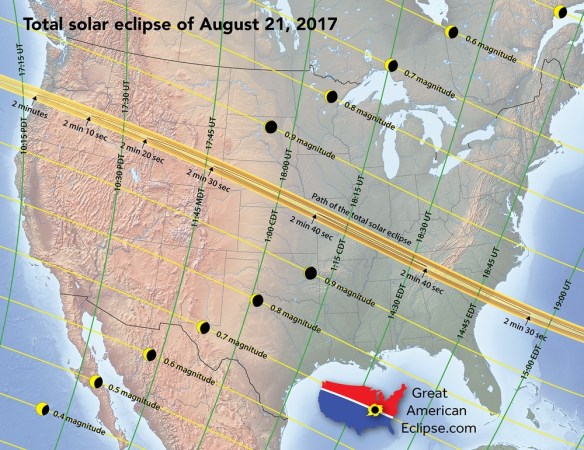
On August 21, 2017, the continental United States will experience a rare total solar eclipse that sweeps the nation from Oregon to South Carolina. Taking 94 minutes for the Moon’s shadow to race across the country, the duration of the total solar eclipse can last from 2 minutes near Depoe Bay, Oregon, to 2 minutes 41 seconds (the max) near Carbondale, Illinois, and 2 minutes 30 seconds near Awendaw, South Carolina. This will not happen again in the US until 2023 for an annular eclipse and 2024 for a total eclipse.
To help you plan your trip, take a look at these many maps including a 10 foot long strip map of the eclipse path. For more info, click below.
Interesting interactive map showing gun deaths in the US. The map is based on data from the U.S. Centers for Disease Control and Prevention and shows the average number of gun deaths per 100,000 county residents from 2004 through 2010.

Note that the “gun deaths” map combines homicides, suicides, and accidents. There are also separate maps for suicides and homicides. Suicides really skew the statistics.
Thanks to Barry Waite of the City of Carson for finding this one.
If you work with transit data, you might want to take a look at the following blog post. Some great suggestions:
Check it out.
![]()
Looking to get into Python for spatial data analysis? Check out this online video. The video notes state you will learn about geoprocessing, analyzing and visualizing spatial data using Python and how it compares to other available options such as desktop GIS options (ArcMap or QGIS) or R. The talk will introduce various Python projects such as PySAL, GeoPandas, and Rasterio, and give attendees a starting place for independently exploring and learning geoprocessing skills using Python.
Slides for the video can be found here.
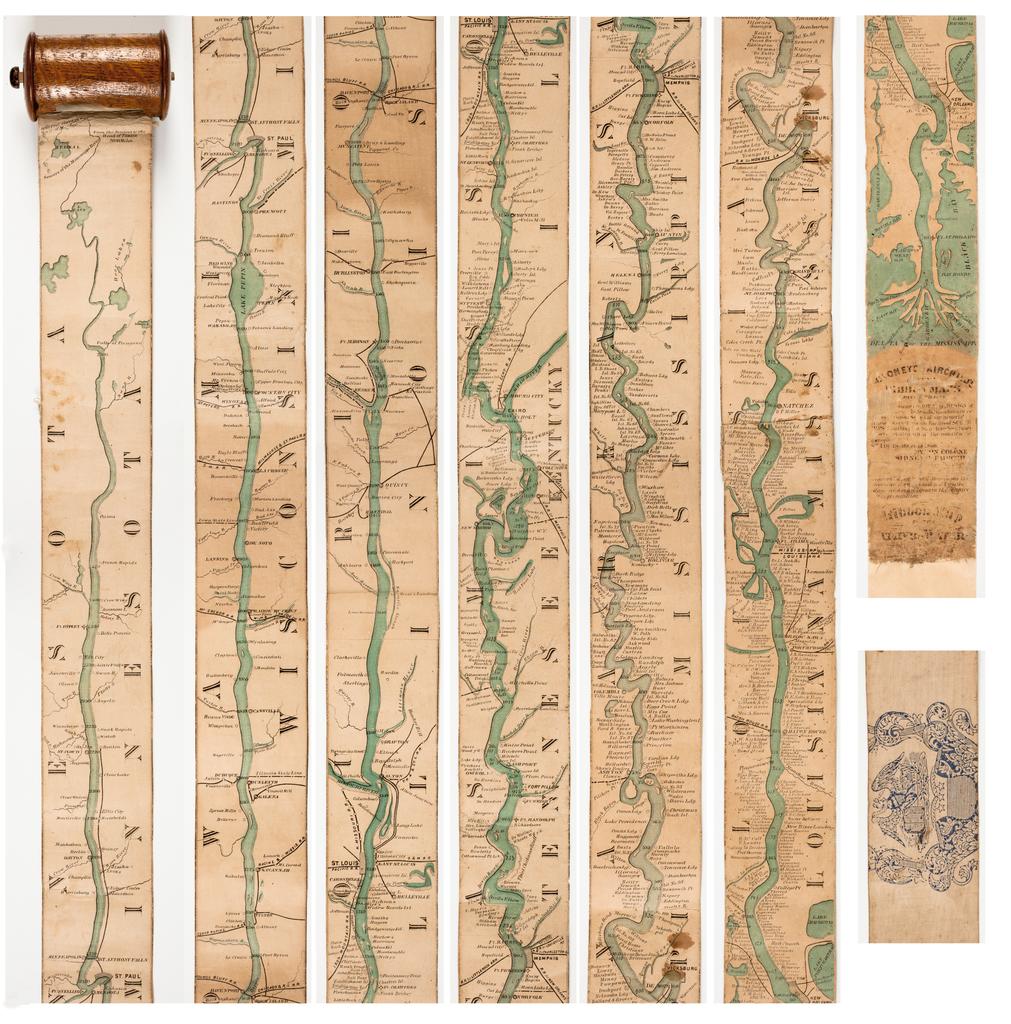
I have always liked strip maps. They go from one point to the other, maybe traversing a very long distance. The paper map can be very long and show a lot of stuff along the way. It’s like going on a trip without leaving your chair.
Here is an interesting 1866 strip map of the Mississippi River, allowing you to see the Father of Waters all at once. It was made for the steamboat traveler at the time and rolled up into a spool. Check it out and the history behind it.
If you are interested in illustrated conceptual maps, want to learn more about creative cartography, or want to see examples from illustrators around the world, The Art of Illustrated Maps by John Roman might be interesting to you. This is the first book ever to fully explore the fascinating world of illustrated conceptual maps. Check it out!

Happy Columbus Day to you, and a map too!

You also might find interesting the Top 5 Misconceptions About Columbus.
Do you use SQL Server and are thinking about using Collector to store potentially large amounts and data and pictures? Check out this article. Experts from the Ohio Department of Transportation provide a detailed workflow example, with step by step instruction, for using FILESTREAM with Collector for ArcGIS to gather, manage and store extremely large datasets in the best ways possible for performance, management and scalability, in line with current industry best practices.
