I’ve noticed that firework stands are appearing around town, which reminds me that the 4th of July is almost here and that means FIREWORKS!
Like the many years before, the famous Fireworks app will tell you when fireworks will start to be sold in SoCal cities that allow them and when you can light them up! Check it out!
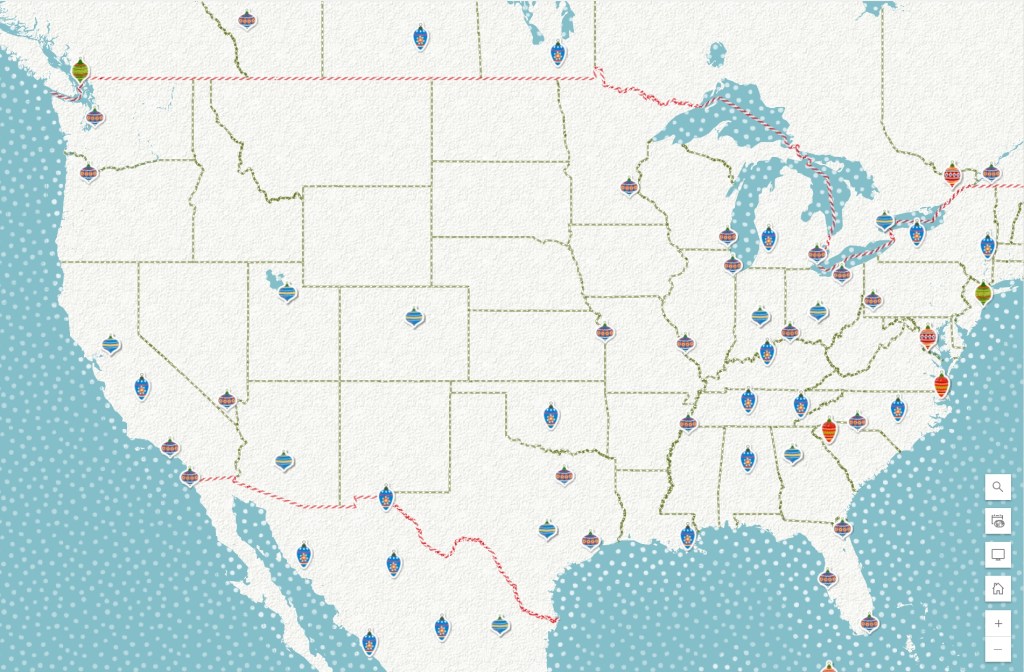
I wanted to say Merry Christmas to all and share the Merry Christmas Map (v2) from ESRI. The web map provides a detailed basemap for the world symbolized with a unique twist on the Christmas holiday. Check it out!
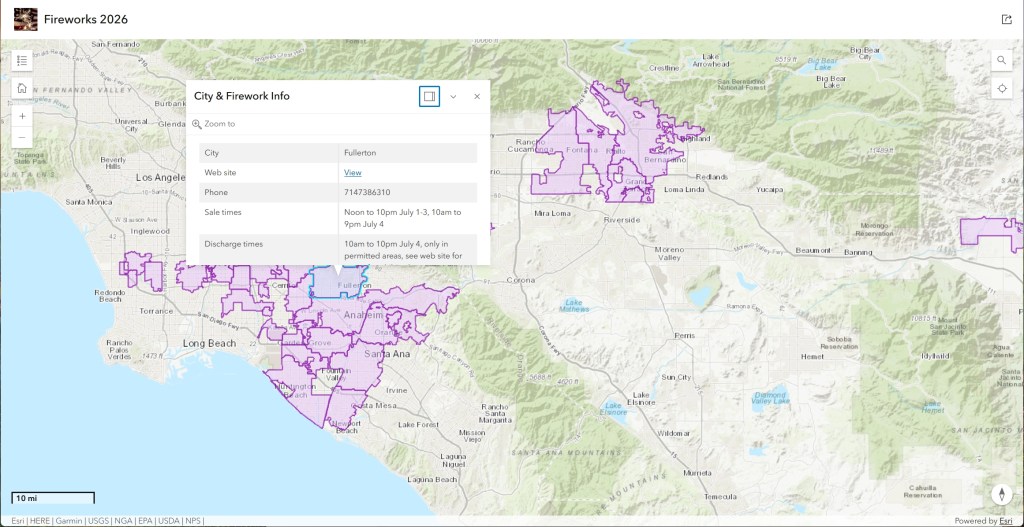
Yes, it is almost July 4th again and our famous SoCal Fireworks app has been updated for 2025.
For this year the City of Orange has joined the other cities that allow fireworks. Sadly the City of Carson and City of Inglewood decided to ban fireworks for this year.
Use the app to view cities that allow the sale and discharge of fireworks in LA, Orange, Ventura, Riverside, and San Bernardino counties. Included are days and times when fireworks will be sold and when you can light them up, as well as links to city websites and telephone numbers. Data was collected from municipal codes, websites, and/or contacting each city. Data provided as is. Some cities are allowing sales now. Check it out and be safe!
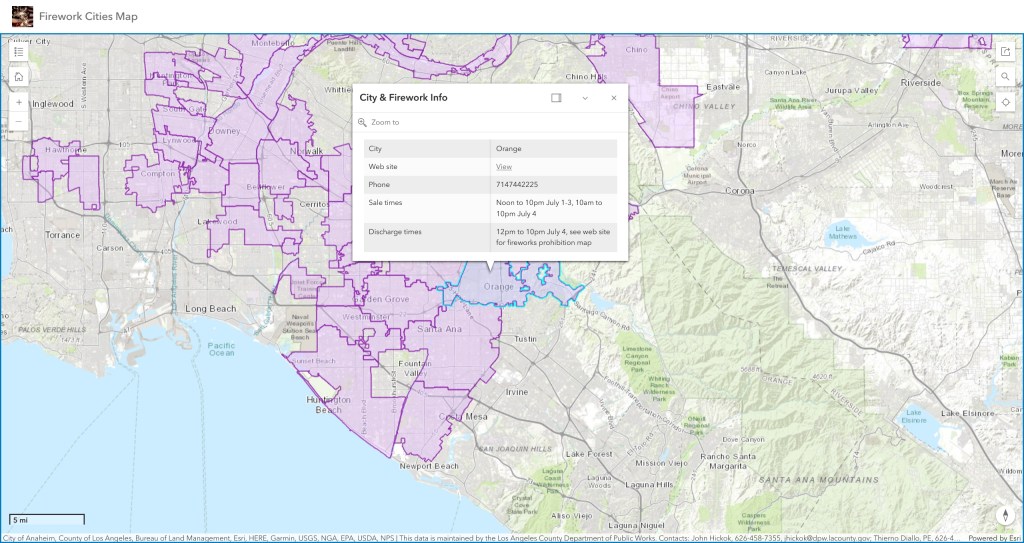
It’s that time again … July 4th and fireworks! Only some areas in SoCal are allowing the sales of fireworks. Where can you go?
Use the app to view cities in LA, Orange, Ventura, Riverside, and San Bernardino County that allow the sale and discharge of fireworks. Included are days and times when fireworks will be sold and when you can light them up, as well as links to city websites and telephone numbers. Data was collected from municipal codes, websites, and/or contacting each city. Data provided as is. Some cities are allowing sales now AND allow you to discharge them as well! Check it out and be safe!
Last week, ESRI launched Maps.com, a media website designed to celebrate maps and introduce the power of mapping to the world. Each week, the Maps.com editorial team publishes content to engage you and help you learn about the world through maps. Topics range from local issues to areas of global interests, and includes content contributed from the GIS community. Check it out!
Don’t miss the annular solar eclipse tomorrow! Though it will not fly by SoCal (we get about 70% of it), if you happen to be under the path in another State tomorrow, look up! Click below for more info.
Check out this 10 foot square map of the world created in 1587! The map was hand drawn in a 60 sheet manuscript. The sheets were scanned and digitally joined to view the map in it’s entirety for the first time. Check it out!