Check out this map of Google autocomplete results from the typed in statement “Why is [state] so …”.
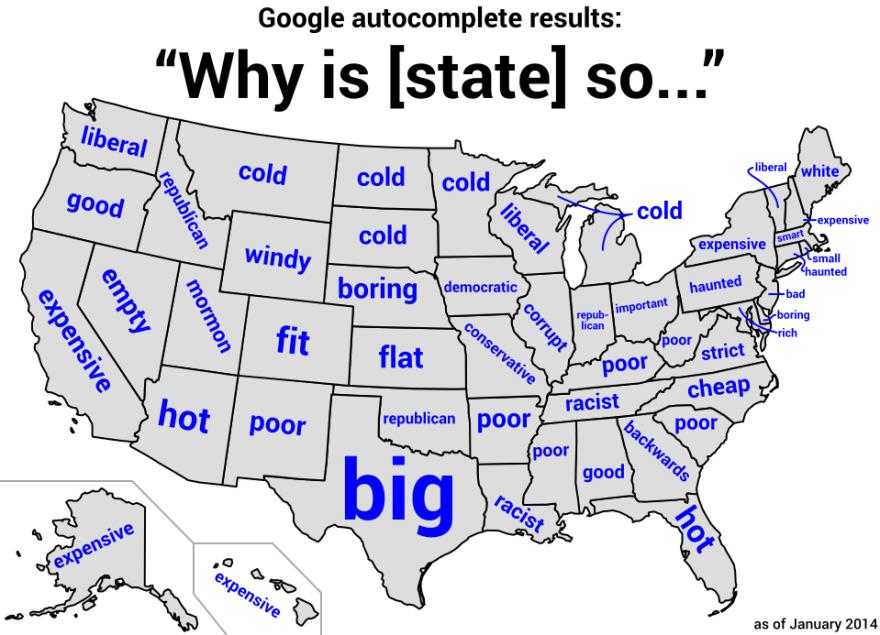
Mind you it is from 2014, but still fun.

Check out this map of Google autocomplete results from the typed in statement “Why is [state] so …”.
Mind you it is from 2014, but still fun.
Rio Hondo College GIS will be hosting a field exercise for aerial survey mapping at the Robert Redford Sustainability Center in Claremont on Saturday December 11th 9am to noon. Go check it out.
Check out this map of UFO sightings! The dataset the map uses contains over 80,000 records of UFO sightings over the past century (between 1910 and 2014), and the data displayed lapses from year to year. You can control which year’s data is displayed using the Time Widget at the bottom of the map. Check it out!

After reading up on what the US Census is doing to the 2020 Census data, I have to consider if I can really trust the data to be used for other applications?
You see, the US Census decided to use “differential privacy”, a mathematical technique to introduce statistical noise to “blur” the data. Their reasoning is that because we have powerful computers, anyone could use other data and cross reference the census data to find information on individuals. You can read about it from the US Census here.
However, what happens to the census data, especially at lower levels like the block level, they start messing around with actual numbers of people and other traits like ethnicity, age, sex, etc. For example, according to the US Census, 48 people live on New York’s Liberty Island, but actually no one has lived there since 2012. It also looks like some US States and organizations will be legally challenging the US Census data and the differential privacy technique. To be fair, the US Census has always implemented privacy safeguards using different techniques like “swapping”, but this new technique seems pretty drastic and really not needed. As data scientists duke it out, you can read all about this issue here.
Will you trust the 2020 Census data? You will need to look at it in your own jurisdiction. Burbank’s population strangely went down, so I need to investigate and look at the data more closely. We will need to determine if we can use this data at a tract, block group, or block level to make more informed and accurate decisions. As they say, your mileage may vary. They also say buyer beware!
It seems like we have been waiting forever for some 2020 Census Data. Well, you can get started with the P.L. 94-171 2020 Census Redistricting Data. It has been available since August 12. You can find the FAQ page for the product here. Keep in mind the redistricting data only includes demographic characteristics by state, county, city, down to the block level:
Note you will need to merge the data files with the tract/block group/block TIGER/Line Geodatabases. A feat that has become a little more difficult since you need to manipulate the data a bit to do it. You can read the technical document to find out more.
There is another option and probably an easier one.
Continue readingESRI and Autodesk are working together to bring GIS and building information modeling (BIM) across multidisciplinary teams and project life cycles. GIS extends the value of BIM design data through visualization and analysis of structures in the context of the natural and built environment. GIS and BIM integrations enable designers and engineers to design smarter, more efficient buildings and infrastructure.
Attend virtually at Autodesk University this year to hear industry leaders discuss GIS integrations for Autodesk and learn how geospatial engineering drives better decision-making. Discover more about ESRI hosted classes and to schedule a meeting at the virtual booth. Click below for more info.

Get caught up on the latest legislation and policy news compiled by the GIS Council Policy Advisory Workgroup. Click here for more info.
Found this interesting article how how you can use a checklist as a guide to review your geospatial strategy or as a final checklist to see if you hit the mark. The checklist includes the following 13 factors:
World Imagery Wayback is a digital archive, providing users with access to the different versions of world imagery created over time. Each layer in the archive represents a snapshot of the entire World Imagery map, as it existed on the date it was published. Wayback currently provides access to all published versions of World Imagery, dating back to February 20, 2014. There is an ArcGIS Online item for every version which can be accessed directly from this app.

There will be an ESRI Infrastructure Management & GIS Conference in Palm Springs from October 25-28, 2021. This crossover event provides learning opportunities to users from infrastructure sectors, creating a richer, more valuable experience for organizations to move their location intelligence and GIS forward. Join professionals specializing in the management of infrastructure from several interconnected industries—water; electric and gas; district heating and cooling; pipeline; telecom; transportation; and architecture, engineering, and construction (AEC). Requires proof of vaccination for all those attending this event, and masking is mandatory. More info and to register here.
