
It seems like we have been waiting forever for some 2020 Census Data. Well, you can get started with the P.L. 94-171 2020 Census Redistricting Data. It has been available since August 12. You can find the FAQ page for the product here. Keep in mind the redistricting data only includes demographic characteristics by state, county, city, down to the block level:
- Race and ethnicity.
- Population 18 years and over.
- Occupied and vacant housing units.
- People living in group quarters like nursing homes, prisons, military barracks and college dorms.
Note you will need to merge the data files with the tract/block group/block TIGER/Line Geodatabases. A feat that has become a little more difficult since you need to manipulate the data a bit to do it. You can read the technical document to find out more.
There is another option and probably an easier one.
If you have an ArcGIS Online account, you should have access to ESRI’s Living Atlas data. Here they have merged the 2020 census data for you with tracts, block groups, and blocks. You can start a new map and then search for “2020 census” in the Living Atlas data. Here is a list:
USA Census 2020 Redistricting Tracts
USA Census 2020 Redistricting Block Groups
USA Census 2020 Redistricting Blocks
California Census 2020 Redistricting Blocks
I added California because it will be easier to handle all the blocks at a smaller state level. I am going to show you how to open them in ArcMap and select out the area you need to save for yourself.
For each of them, note the Open in ArcGIS Desktop button. Click on that and there are two options, Open in ArcMap or Open in ArcGIS Pro. I selected Open in ArcMap. That downloads a file named ITEM.PITEM, which is an ArcGIS Portal Item file. Go ahead and double click on the file. It will open ArcMap and add it to your table of contents. Here I added the California blocks:

Note if it is grayed out, you need to zoom in. I added my city boundary and zoomed to that:
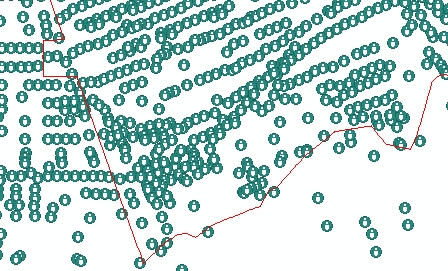
All you see are the centroid points. However, if you do a spatial selection like using the city boundary to select the blocks that intersect, you see something like this:
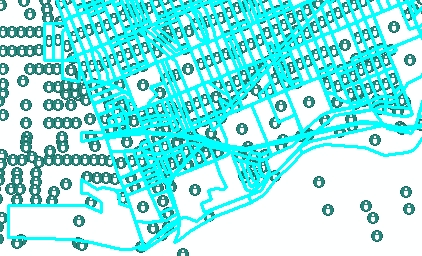
Now export the selected polygons to a geodatabase, and you now have your own census data. Note the attribute table has aliases for the fields:

The aliases have great descriptions of the data. You can turn off the aliases to see the actual field names:

What is in field P0010001? Turn on aliases and find out! Very nice. Thanks ESRI!
I hope this gets you going with 2020 Census data. I am not sure when other data sets will be released, but if you know, please add a comment with a link to the schedule.
