Wishing you all a very Merry Christmas and a great holiday season! Enjoy this year’s Christmas Card … I think Santa is learning about points, lines, and polygons!


Wishing you all a very Merry Christmas and a great holiday season! Enjoy this year’s Christmas Card … I think Santa is learning about points, lines, and polygons!
The California Geographic Information Association will have their next quarterly meeting on 12/8/2022 at 10AM. They will be discussing the MySitePlan Lawsuit (another surveyors vs GIS practitioners issue, more about that here if you are interested) and the FCC Broadband Map/Challenge process. The agenda can be found here.
URISA released the third edition of The GIS Management Handbook. The book is a comprehensive guide and reference to the field of GIS management. It provides practical information on the development, implementation, and operation of GIS programs and projects, for a full range of public sector, not-for-profit, and private sector organizations and companies. This book takes a practical approach providing clear descriptions of concepts, issues, and practices that may be used in operational to improve and maximize the efficiency of GIS programs and projects. The book comes in hardcover and digital versions.

The World Historical Gazetteer (WHG) is providing a collection of content and services that permit world historians, their students, and the general public to do spatial and temporal reasoning and visualization in a data rich environment at global and trans-regional scales. Check it out!
In California, some of our reservoirs are still low. Check out this article and slider apps comparing satellite images of the reservoirs 5 years ago and today.

Looking for a unique gift for someone who loves maps? Check out these shaded relief maps. They are flat 2D maps, but really look like they are jumping off the page in 3D. My guess the bigger the map you get, the better 3D effect on your eyes! Check it out.

You can also visit the author’s project site here.
GIS Day is almost upon us! Check out this video from Jack Dangermond.

The webinar is today, 8-9am PDT. Click here to register.
ESRI Demographics offers the tools to dig-deep and uncover answers to questions ranging from ‘How many people live in a community?’ to ‘How are incomes in a network of commercial businesses changing over time?’. For GIS users who want to take their analysis a step further, ESRI offers ArcGIS Living Atlas (“Living Atlas”) for an enriched demographic data experience. Living Atlas connects users with demographic data layers, apps related to populations impacted by natural disasters or current events, and a selection of models and features to solve the world’s most-critical problems.
Join us for this 60-minute webinar by experts from ESRI Demographics and Living Atlas. You will learn about some of the exciting features available through Living Atlas specifically designed for users looking to upskill with demographic data by ESRI.
If you missed the first workshop over the weekend, don’t worry, there are going to be 2 more!
Join us for the Aerial Survey Mapping workshop on Saturday, November 12 and December 10. The workshop will cover UAS workflow, rules, regulations, and applications. For more information, visit the site here.
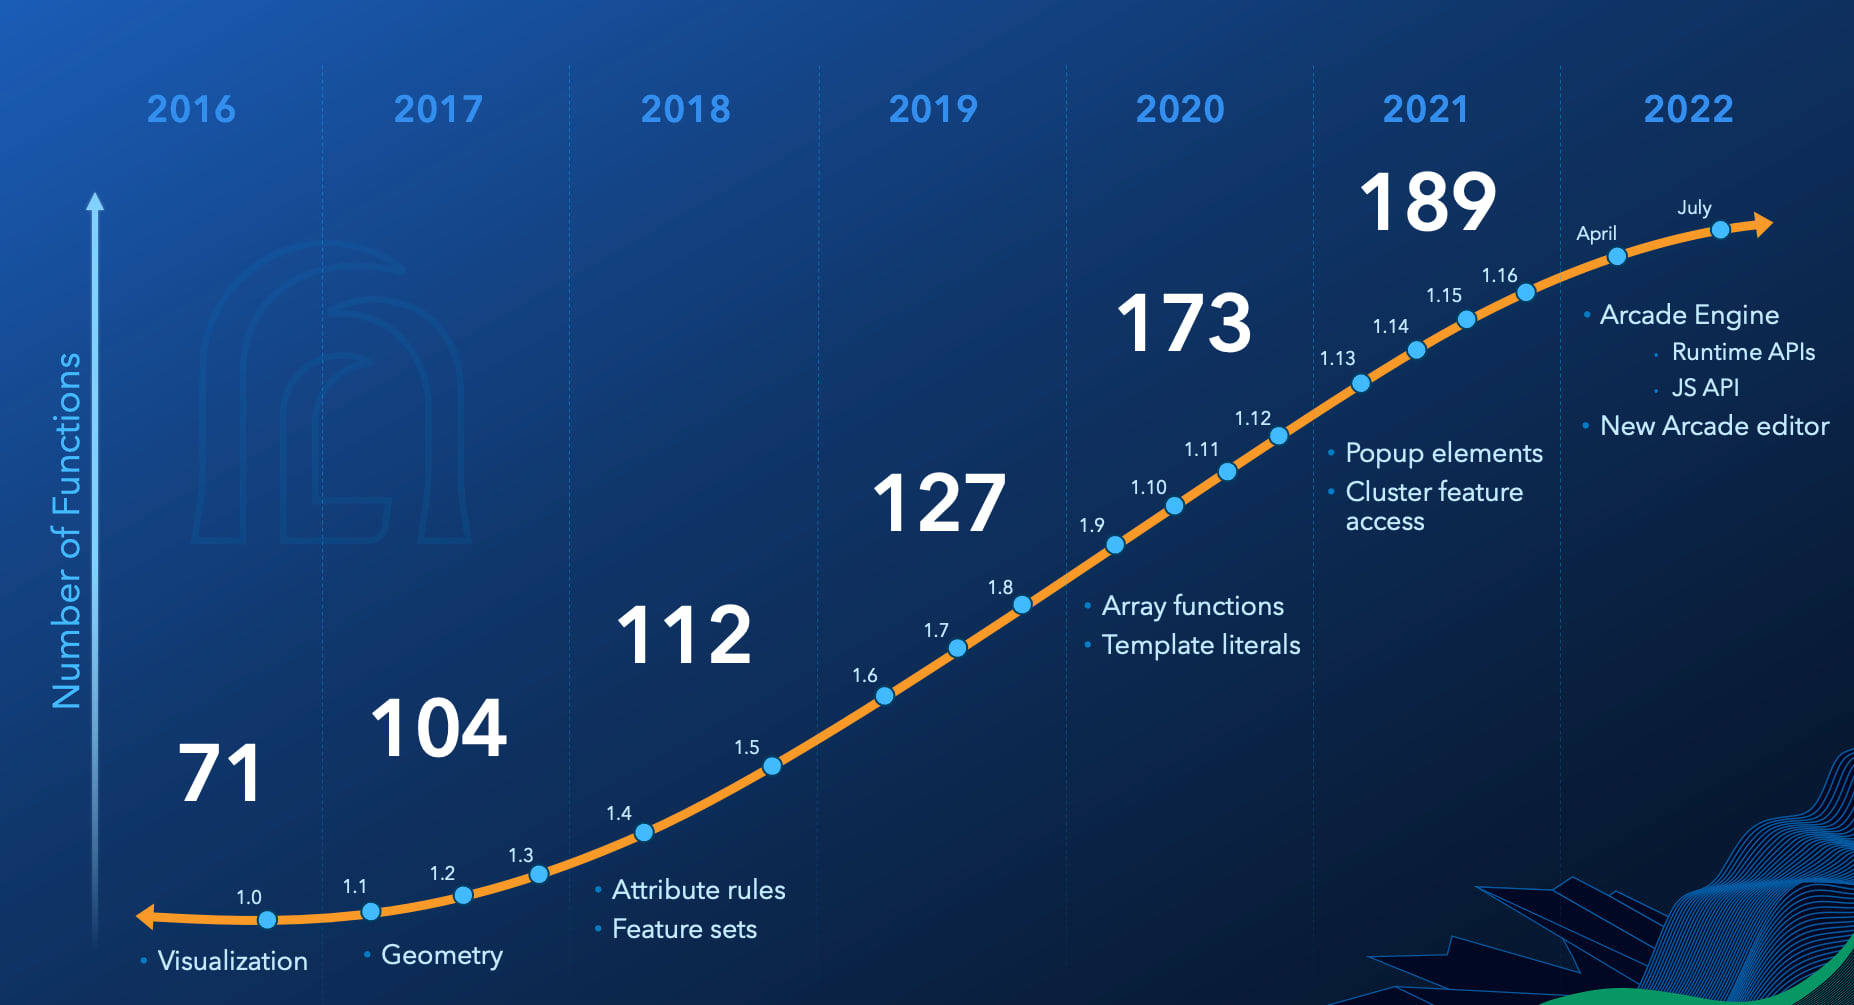
When I hear the word Arcade, I think of the days playing games like Pac-Man, Frogger, and Donkey Kong. However, this Arcade is used to customize ArcGIS apps.
ArcGIS Arcade was first developed to be a calculator. It allows you to compute values derived from attributes in a layer. The result can be used in popups, labels and in renderers. Also the Arcade scripts work throughout the ArcGIS system. In the latest versions of Arcade, you can use it to customize popup content and define conditional behavior in forms and dashboard elements based on user input.
Click below to read more about Arcade and what you can do with it in your ArcGIS apps.