ArcGIS Pro … Very Soon!

After attending the ESRI Conference last week, here is the latest release schedule for ArcGIS Pro:

  • August 2014 – Beta 5 (you can still participate here)
  • September 2014 – 10.3 Pre Release
  • November 2014 – Released as part of 10.3

You can take a look at my last post about ArcGIS Pro.  And here are some extra tidbits of information I picked up at some of the Pro workshops:

  • You will get Pro if you have Desktop
  • Web based install or network install
  • Improved help system, can install local or on server, or not at all
  • Editing is on all the time, no start/stop editing
  • As you work with a layer, the ribbon interface changes for just that layer
  • Bookmarks honor time & space
  • You can export to Excel
  • You can reorder attribute fields
  • True transparency and anti-aliasing when exporting to PDF, smaller file sizes
  • Analysis about 20% faster in Pro
  • Tightly integrated with ArcGIS Online and Server on premise
  • Can use ArcGIS Online as content storage for Pro
  • License levels based on your Desktop license level (Basic, Standard, Advanced)
  • Licenses managed via ArcGIS Online or Portal
  • You grant access to Pro to named users
  • You control product level and extensions for each named user
  • Will show which users are using Pro and how much
  • All popular extensions available in Pro
  • Note: 3D Analyst extension not needed to view 3D data, only for 3D data analysis
  • Python scripts run in Pro with minor changes (no map docs, project files instead)
  • Uses Python 3.4, 64bit
  • You can customize the UI for users
  • You can extend Pro with .NET API, beta this fall and released 2015 Dev Summit
  • Note: No data driven pages in first release of Pro, python script will be provided
  • Note: Cannot create geoprocessing services in the first release of Pro

National Seismic Hazard Maps Updated

Parts of 42 states are at risk of earthquakes during the next 50 years, according to a new report from the U.S. Geological Survey.

The report includes updated maps that show geologists’ predictions of where and how often future earthquakes may occur, and how strongly they may shake the ground.

Many of the at-risk states are in the country’s western half, but the map also highlights hotspots in the Midwest and Southeast. There are 16 states that have regions labeled as being at high risk for seismic activity, because they have histories of earthquakes measuring a magnitude of 6.0 or greater: Alaska, Arkansas, California, Hawaii, Idaho, Illinois, Kentucky, Missouri, Montana, Nevada, Oregon, South Carolina, Tennessee, Utah, Washington and Wyoming.

In making the new maps, geologists considered data from earthquakes that have struck since the maps were last updated, in 2008. For instance, the 5.8 Virginia temblor that struck in 2011 showed that seismic activity can happen in the Northeast. Seismic risk has also increased near Charleston, South Carolina, due to recent earthquakes in the area.

The map gave the Big Apple a slight reprieve. Geologists downgraded the risk that slow-moving waves from an earthquake would hit near New York City. Slow shaking is more likely to damage tall buildings than fast shaking, which is more likely to affect smaller structures.

In California, new information about faults in San Jose, Vallejo and San Diego have raised earthquake risks there. In contrast, the cities of Irvine, Santa Barbara and Oakland have reduced risks, thanks to new insights on the faults in those areas.

The new USGS maps are part of the National Earthquake Hazards Reduction Program, a partnership of four federal agencies created by Congress to reduce the risks to life and property caused by earthquakes. In addition to the USGS, the other agencies include the Federal Emergency Management Agency, the National Institute of Standards and Technology and the National Science Foundation.

British Library Needs Your Georeferencing Help

Over 3,000 (primarily) 19th century maps in books from the British Library collections have been extracted from the scanned volumes and they need your help georeferencing and overlaying the scanned maps. To help, visit http://www.bl.uk/maps/ .

The images are public domain and may be downloaded from Flickr (jpeg), and the overlays (kml) and coordinate data (wld) from BL Georeferencer.

britishlibrary

Fireworks 2014: Where to Buy and Light!

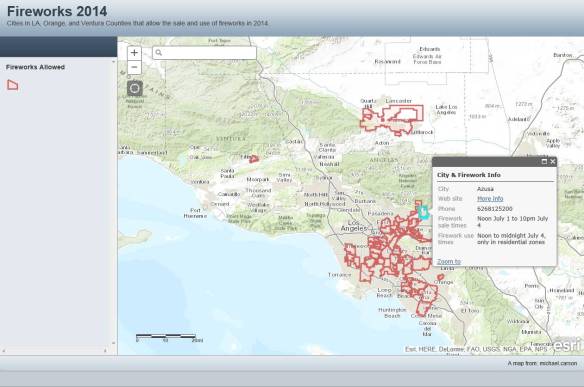
It’s that time again … Fireworks!  This year the fireworks app has been expanded to include cities in Orange County and Ventura County.  Included are days and times when fireworks will be sold and when you can light them up, as well as links to city web sites and telephone numbers.  Data was collected from municipal codes and/or contacting each city.  Enjoy!

fireworksapp2014

National Weather Service – Impact Based Statistics

“In an ever-growing effort to provide valuable weather information — or just a vulgar display of automated GIS skills — the National Weather Service is tweeting out images that show how many people are impacted by severe weather. The exercise shows just how little of the United States is populated.”

Thanks goes to Peter King of iWater for pointing out this article.

EIS Mapper

If you deal with environmental issues or if you work with planners who are developing sites, this website may be useful.

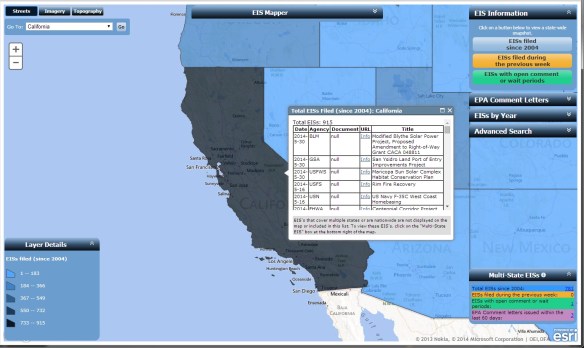
The EIS Mapper displays information for each state with data from EPA’s Environmental Impact Statement (EIS) Database.  Included are EISs filed since 2004 up to the present (previous week), statements with open comment or wait periods, and EPA comment letters.  Using the map application, you gain access to electronic copies of the documents.

The EIS Mapper is a valuable tool for environmental research, planning and municipal developers, property owners, legal research of companies and properties, and for anyone doing historical research on environmental related activities in the United States.  Check it out.

eismapper