MaptimeLA is a group of people working on maps, learning about geospatial data, and teaching each other the latest cartographic tools. Check them out and join today. They are also on Twitter.
Category Archives: Maps/Apps/Charts/Data
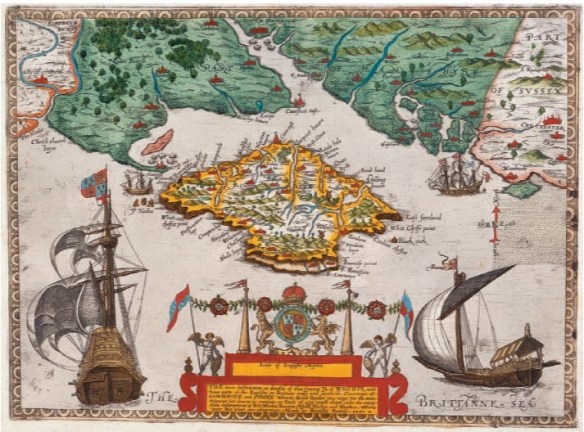
The History of Cartography Project
The History of Cartography Project has been awarded a five-year grant from the National Science Foundation to study the origins and development of modern cartography. The research will facilitate preparation of Cartography in the Nineteenth Century, Volume Five of the groundbreaking History of Cartography series.
This unique, international research and publishing venture, based at the UW-Madison, is dedicated to promoting a deeper understanding of cartography among scholars and the general public. The first three volumes of the series are available in print and are freely available online. The final three volumes will be published in print, as e-books, and online as well.
Map Fight!
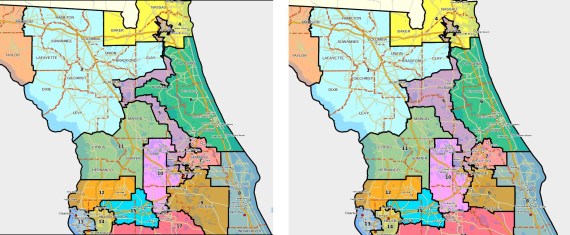
There is a map fight brewing in Florida. Florida legislators completed their hasty fix of a congressional redistricting map in an attempt to address the concerns by Circuit Court Judge Terry Lewis, who said the map violated a constitutional ban on partisan gerrymandering. Click below for a fun read.
Don’t Fly Drones Here
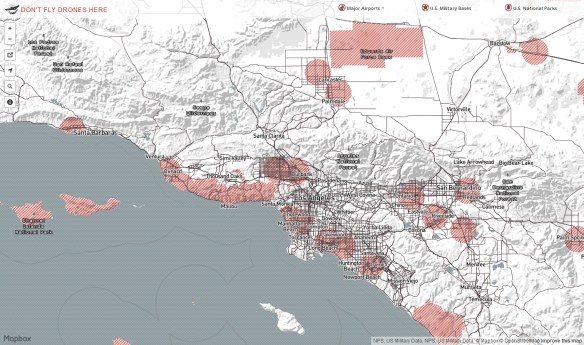
This interactive map represents areas where it is not permitted to fly drones due to current FAA regulations. Brought to you by Mapbox.
Energy Infrastructure with FEMA National Flood Hazard
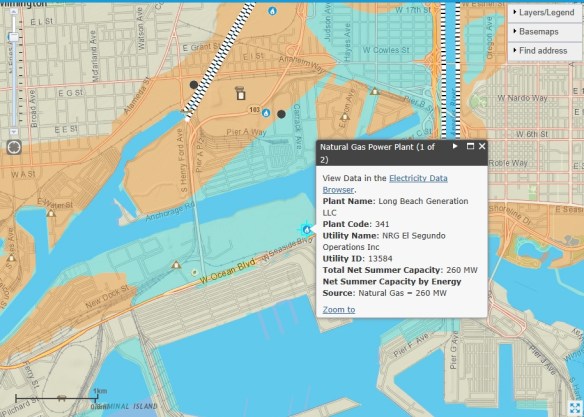
This week the US Energy Information Agency announced the availability of a new mapping tool that details the flood risk faced by our existing energy infrastructure. The map has icons located on sites like distribution terminals and power plants and allows users to overlay the existing flood risk on those sites. The clear message is that a lot of our infrastructure is already at risk.
Flood hazard information from FEMA has been combined with EIA’s energy infrastructure layers as a tool to help state, county, city, and private sector planners assess which key energy infrastructure assets are vulnerable to rising sea levels, storm surges, and flash flooding.
National Parks Live
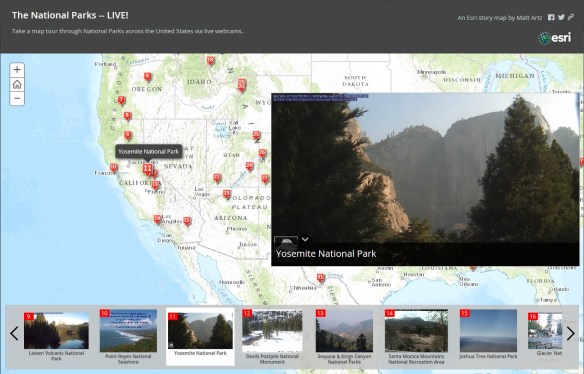
Want to know what Yosemite National Park looks like right now? I found this interesting app that takes you on a map tour of our National Parks via live webcams.
I found some of the webcams not working or displaying an old image, but the ones that do work give a great picture of that area about the time you load the app. I found if you reload the app a few minutes later, those webcams that are working will update their video feed. Pretty cool.
National Hydrography Dataset (NHD) in ArcGIS Online
How to use the National Hydrography Dataset (NHD) in ArcGIS Online by Al Rea
Have you ever wanted to get a very quick view of what’s in the NHD for an area that you haven’t downloaded? Even if you have the data on your hard drive, I’ve found the quickest way to see the basic NHD features is through the ArcGIS Online (AGOL) viewer. I’ve made a very simple web map in AGOL that accesses an NHD dynamic map service from The National Map (TNM). To give it a try, open this link: http://bit.ly/1puvHOn
Zoom to your area of interest. You can use the standard map zoom tools, or type in a place name or street address in the search box in the upper right of the window. You need to be zoomed in to a scale where the NHD streams can be displayed reasonably. If you don’t see any streams on the map, click on the “plus” symbol in the upper left corner of the map to zoom in more. Notice that in the legend there is a scrollbar once you’re zoomed in so that streams begin to display. The NHD streams are called “Flowline – Small-Scale” or “Flowline – Large Scale”, and appear at the bottom of the legend. You will need to zoom in so that the scale bar in the lower left corner of the map shows one mile or less to see the ephemeral streams, which are in a dashed brown line style. (Note that ephemeral streams are not shown in all areas.) Intermittent streams are shown in a light blue dashed line style. If you have used this service in the past, you may notice that the symbology has changed recently.
There are several other map services from The National Map that might be of interest to you. A listing can be found here: http://viewer.nationalmap.gov/example/services/serviceList.html. You can bookmark that URL, or just remember this: Search for The National Map, go to the main page, and on the left under Products and Services, click on the Framework Web Feature Services link. You should be able to open the ArcGIS Online map above without having an AGOL login account. If you do have an account, you can save the map as your own and customize it as you like. The TNM services listed above may also be added to your map, along with anything else that is out there on the web.
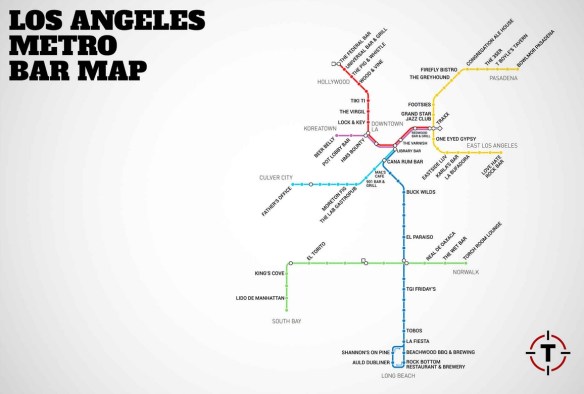
LA’s First Metro Rail Bar Map
2014 National Transportation Atlas Database
The 2014 National Transportation Atlas Database, which has GIS data for transportation, was released last week. It is available for free on DVD from the U.S. Department of Transportation.
The DVD is a set of nationwide geographic databases of transportation facilities, transportation networks, and associated infrastructure. These datasets include spatial information for transportation modal networks and intermodal terminals, as well as the related attribute information for these features. Metadata documentation, as prescribed by the Federal Geographic Data Committee, is also provided for each database.
Stanford University to House David Rumsey Map Collection
Stanford University Library has started preparations to receive the David Rumsey Map Collection. David Rumsey began gathering his map collection over 25 years ago and announced in 2009 that it would be donated to Stanford. According to Rumsey, technology has risen to the forefront in the University’s plans for the collection and the map center. Computerized tools, such as video and touch-sensitive walls, will be available beside the physical maps. ArcGIS will also be incorporated.