Check out these maps and article about 15 fast food chains that dominate in the US.
Check out these maps and article about 15 fast food chains that dominate in the US.
Here is an interesting article about using a drawing option in ArcMap called Match To Symbols. By naming a feature attribute with the same symbol name that is in a style, you can quickly symbolize them for feature categories. Click below to read.

This is just like when us old school GIS types used a field to store a symbol number to symbolize our points, lines, and polygons!
Here is an interesting article from the UK about how map reading seems to be a lost art. People have stopped being able to read maps in the age of automatic mapping … people are instead increasingly read by maps! Map reading should be a basic life skill and maybe we should start teaching it in schools again.

Today is GIS Day! If you are looking for a place to check out, may I suggest the GIS Day celebration at Los Angeles County. They put on a big show and have many booths and presentations.
You can find other places that are celebrating GIS Day by checking out the GIS Day map below.
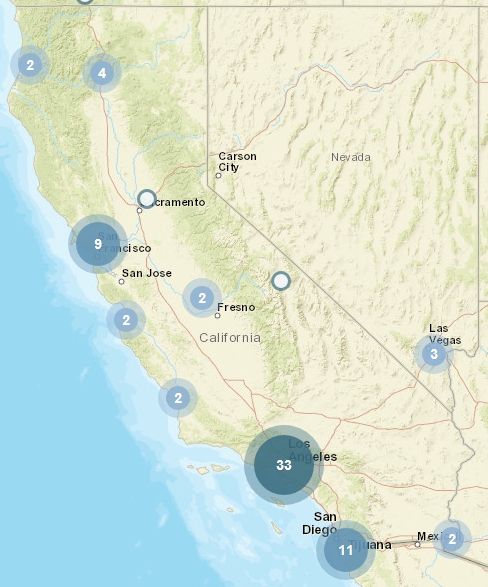
Happy GIS Day!
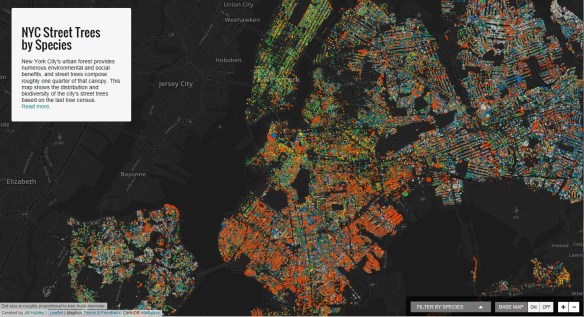
If you are a tree lover or interested in urban spaces, you will want to check out Jill Hubley’s interactive map of New York City Street Trees by Species. You can choose to zoom in on a particular neighborhood (or even block) to learn about the particular tree species in that area. Alternatively, you may conduct a search for a particular species to see where that species is distributed across the city.
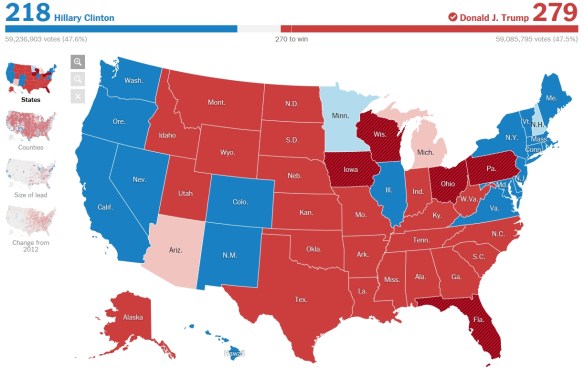
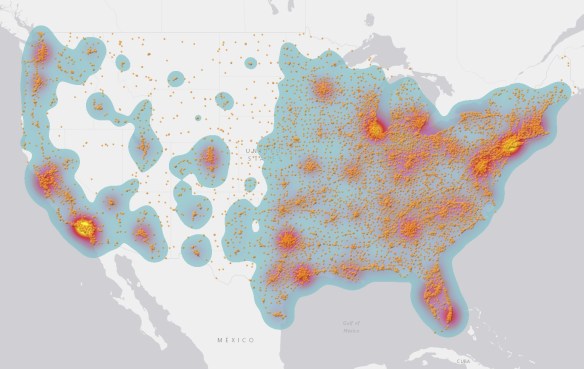
The LA Times has an interactive map at the precinct level for Los Angeles, Orange, and other counties to see how others in your neighborhood voted. Check it out!

This ArcGIS Online web map shows imagery for the planet that is updated on a daily basis. It features the NASA MODIS imagery True Color band composition (Bands 1 4 3 | Red, Green, Blue) which most accurately shows how we see the earth’s surface with our own eyes.
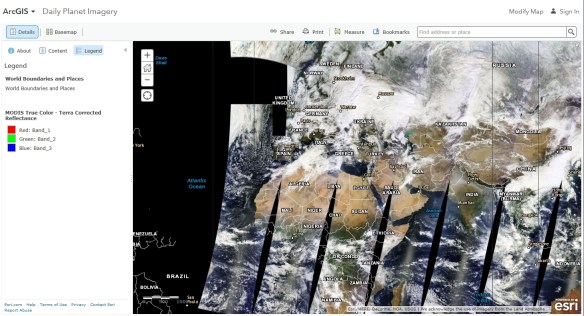
The image service supporting this map is time enabled, but time has been disabled on this image layer so that the most recent imagery displays by default. If you would like to view imagery over time, you can update the layer properties to enable time animation and configure time settings. The results can be saved in a new web map to use later or share with others. More about the MODIS imagery image service here.
This interactive map displays non-seasonally adjusted California Labor Force and Unemployment Data for all 58 counties and 21 major cities ranked by population size.

The capability to easily create digital contours using commercial off-the-shelf (COTS) software has existed for decades. Out-of-the-box raw contours are suitable for many scientific applications without pre- or post-processing; however, cartographic applications typically require additional improvements. For example, raw contours generally require smoothing before placement on a map. Continue reading