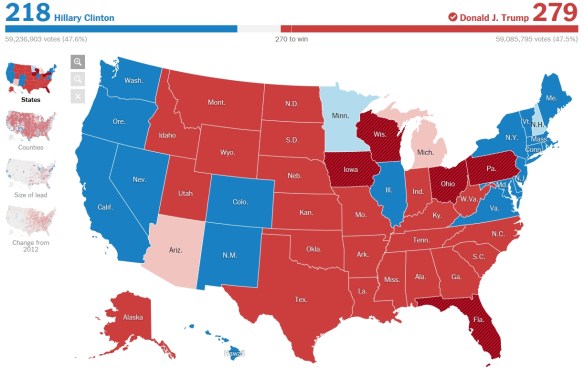
The LA Times has an interactive map at the precinct level for Los Angeles, Orange, and other counties to see how others in your neighborhood voted. Check it out!


The LA Times has an interactive map at the precinct level for Los Angeles, Orange, and other counties to see how others in your neighborhood voted. Check it out!
This ArcGIS Online web map shows imagery for the planet that is updated on a daily basis. It features the NASA MODIS imagery True Color band composition (Bands 1 4 3 | Red, Green, Blue) which most accurately shows how we see the earth’s surface with our own eyes.
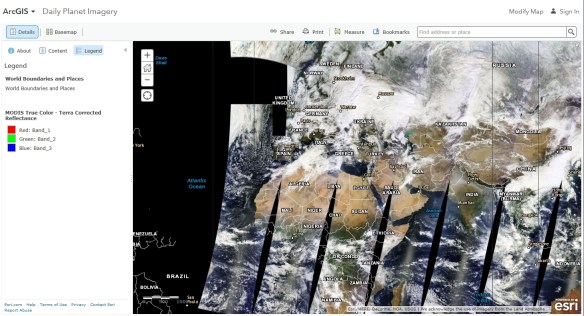
The image service supporting this map is time enabled, but time has been disabled on this image layer so that the most recent imagery displays by default. If you would like to view imagery over time, you can update the layer properties to enable time animation and configure time settings. The results can be saved in a new web map to use later or share with others. More about the MODIS imagery image service here.
This interactive map displays non-seasonally adjusted California Labor Force and Unemployment Data for all 58 counties and 21 major cities ranked by population size.

The capability to easily create digital contours using commercial off-the-shelf (COTS) software has existed for decades. Out-of-the-box raw contours are suitable for many scientific applications without pre- or post-processing; however, cartographic applications typically require additional improvements. For example, raw contours generally require smoothing before placement on a map. Continue reading
Governments already using the Esri ArcGIS platform can quickly and easily exchange data with Waze through the Waze Connected Citizens Program, a free, two-way data share of publicly available traffic information.
Waze provides governments with real-time, anonymous, Continue reading
What many people love most about the fall are the vibrant colors that mark the transition from summer to winter. Temperature, the amount of sunlight, and precipitation all affect how quickly the foliage will change from green to red, yellow, or orange. This interactive tool illustrates where autumn colors are peaking across the United States.
The map uses data from NOAA precipitation forecasts, daylight and temperature forecasts, historical precipitation data for this year, as well as other government and private data sources to visually indicate the foliage change between August and November, noting seven degrees of change. In addition to helping users plan a weekend getaway to enjoy fall’s many colors, the site offers some science trivia about what causes leaves to be certain colors and why leaves fall. Check it out!

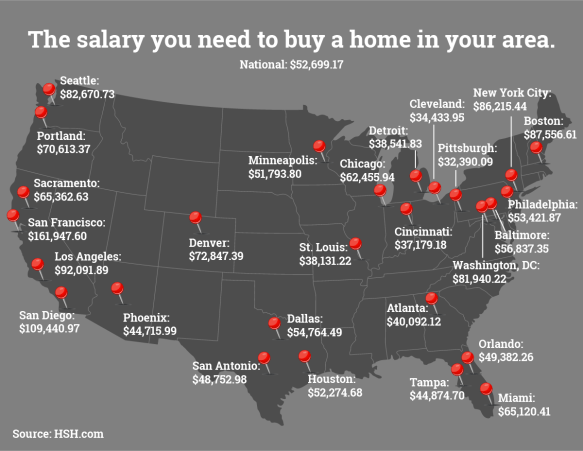
How high does your salary need to be to comfortably buy a house in your city? In LA, it looks like you need to be making $92,091.89. The mortgage database HSH put together this map that analyzes the salary needed to buy a home in different parts of the country. The map is based on the median home prices in metro areas including the surrounding suburbs, and assumes you will have a 30 year fixed rate mortgage with a 20 percent down payment and be able to afford the base cost of owning a home (principal, interest, taxes, and insurance).
Forget about food if you buy in San Francisco!
The US government is one of the world’s largest publishers, both in paper and on the web. More than 200 years ago Congress authorized the sending of free copies of certain government publications to libraries around the country. This developed into the Federal Depository Library Program (FDLP), with more than 1,100 public, academic, and government libraries as members. Each of these libraries receives government materials for free, and is required to make them available to the public.
The Federal Depository Library Program is run by the Government Printing Office (GPO), which recently changed it’s name to Government Publishing Office in order to indicate it is now more involved with electronic data rather than paper.
If you are looking for government publications and other federal information, give these online sources a try: Continue reading
The Southern California Association of Governments (SCAG) won Best of Show in the ESRI UC Map Gallery for its Visualization Tool – Scenario Planning Enhanced 3D GIS. They also won the award for Most Unique map for the same visualization tool.
Congratulations SCAG! Check them out and other award winners by clicking below.