For the past several centuries, cartographers have tried to find different ways to portray the globe on a two-dimensional map. Many of these attempts, including the Mercator projection, distort the true size of different countries and regions. As a result, many of us have false perceptions about the proportional size of different geographical areas.
Category Archives: Maps/Apps/Charts/Data
Persuasive Cartography
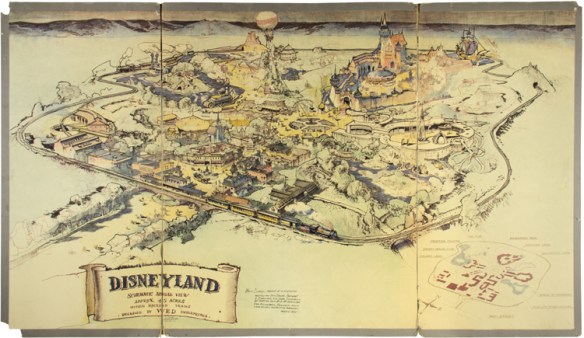
Looking for unusual maps? Check out this website that makes available to the public a collection of more than 800 examples of persuasive cartography, maps intended primarily to influence opinions or beliefs – to send a message – rather than to communicate geographic information. You can search for maps by subject and there are also links to download the high resolution image of each map.
Nautical and International Waters Charts
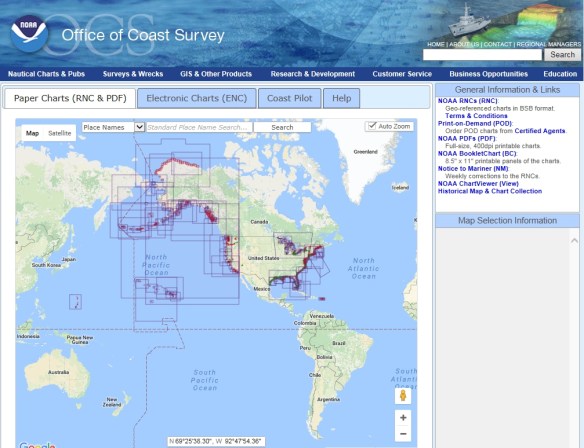
Are you looking for nautical charts? NOAA’s paper nautical charts are available as “print on demand” up to date to the time of purchase. You can also download charts in PDF format for free.
Looking for open ocean and international waters charts? They are produced by the National Geospatial-Intelligence Agency (NGA) and available through vendors as “print on demand” products.
Geography of the Post Office
During the second half of the nineteenth century, the introduction of the post office changed daily life in the Western United States. Over the course of 50 years, the number of post offices in this region expanded from just a handful to several hundred. Some post offices were established and stayed in operation long term; others had much shorter life spans as the west continued to change.
Holographic GIS
Flex Projector
Transit Line Colors
An MIT grad student created a chart showing the colors used in many transit line agency maps and posted it on his Twitter account. Also, someone posted a response that the colors these agencies use are not very great for people with red-green color blindness and updated the chart to show the issue. Check it out!
SCAG/ESRI Story Maps Student Challenge
Calling all students! The Southern California Association of Governments (SCAG) is currently accepting abstracts for a student showcase at our annual Regional Conference and General Assembly on May 4 and 5 in Palm Desert. SCAG is looking for outstanding student work in two categories: sustainability planning posters and ESRI Story Maps using SCAG data. Continue reading
National Transit Map
Flow Mapping for ArcGIS JavaScript API
Need the ability to visualize a flow of things on a map? A new library for the ArcGIS JavaScript API called the Canvas Flowmap Layer allows you to map the flow of objects from an origin point to a destination point using Bezier curves. The directionality of the flow can be visualized as moving dots too. Check it out!