Interesting infographics and maps about roadway fatalities by substance type. Data includes drug and alcohol related roadway deaths from 1995 to 2013. Looks like LA County drivers like stimulants.


Interesting infographics and maps about roadway fatalities by substance type. Data includes drug and alcohol related roadway deaths from 1995 to 2013. Looks like LA County drivers like stimulants.
World Imagery Firefly was created for thematic maps. Currently in beta, Firefly is an alternative view of the default World Imagery basemap, and is designed with desaturated colors. When zoomed out, the map appears grayscale, but as you zoom in, the colors become more saturated until the full color detail of the imagery appears. World Imagery Firefly is especially useful for overlays of brightly styled layers when you want an imagery basemap, but do not want the imagery to compete with the layer styling. Check it out.

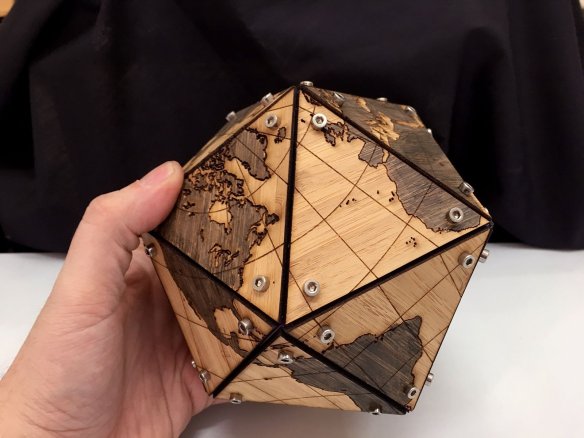
If you like to make stuff, maybe making a laser cut Dymaxion Globe is something you would like to do? Click below to read the article and download the needed files for your laser cutter … you have one right?
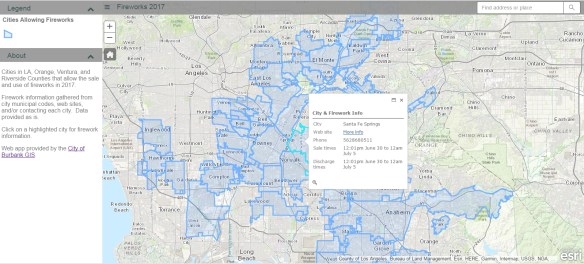
July 4th will be here soon and that means Fireworks! The fireworks app I have used for the past few years has been updated. It includes the cities in LA, Orange, Ventura, and Riverside County. If you love fireworks and want to find out where you can legally buy and shoot them off in SoCal, check out the app!
If your organization participates in LARIAC, then you probably know that right now you have Early Access to the 2017 imagery (both orthos and obliques) in Pictometry’s online CONNECTExplorer application. Keep in mind the Early Access imagery still has work to be done on it, but at least you can take a look at the new stuff while they are working on it.
One thing you can do is bring some of the ortho imagery into your ArcGIS Desktop environment. Here are the simple steps to do so:
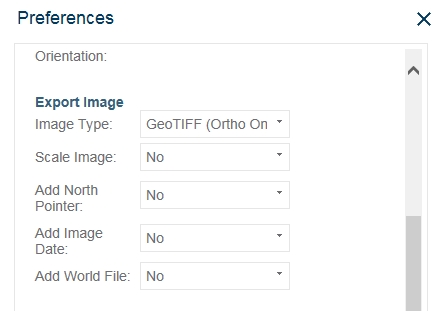


The GeoTIFF images are actually using geographic coordinates (WGS84), but they reproject very well into State Plane.
This is a very quick way to bring in the new 2017 Early Access imagery into your maps if you need to. As the imagery is cleaned up and worked on to create preliminary images, there will be map services setup for you to consume in your applications. But for now, you can use these steps. Enjoy! -mike
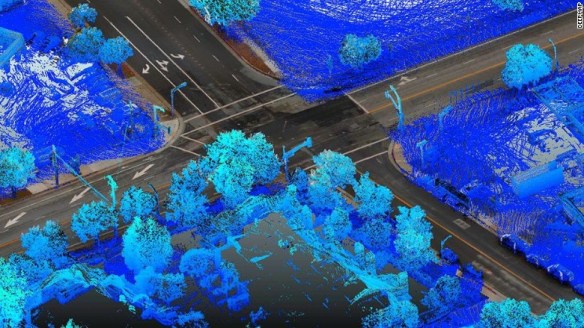
For much of the last decade, digital maps have helped people pull up basic directions while walking and driving. But tech and auto companies are investing in a new generation of maps for a much more demanding audience: self-driving cars. Click below to read the article about “HD maps”.
Today there will be a meetup, June 22nd at 11am (PDT), about what’s coming in the ArcGIS for Local Government UC 2017 release as well as ArcGIS for Local Government events at the ESRI User Conference in July. If you are interested, please join the meetup today by registering here.
After registering, you will receive a confirmation email containing information about joining the webinar.
Looking for a unique map gift? How about a textile map from this Wisconsin textile artist? Check it out!

Looking to do a little prediction mapping using logistic regression in ArcGIS and the R environment … I thought so! This stuff makes my head ache, however if you are interested there is a series of videos that will step you through it. Check it out!

Also, check out this article about ESRI and R support.


