The ESRI Disaster Response & LivingAtlas teams authored this StoryMap Swipe with recent Maxar imagery showing before and after Hurricane Dorian in the Bahamas. Check it out!


The ESRI Disaster Response & LivingAtlas teams authored this StoryMap Swipe with recent Maxar imagery showing before and after Hurricane Dorian in the Bahamas. Check it out!
GIS Essentials Workshop Announcement: Thursday, September 26th, 2019
In the GIS Essentials: Mapping Your Community™ workshop you’ll learn to create maps and analyze data about your local community. The class is perfect for beginners and anyone that would like a refresher on mapping and ArcGIS. Workshops are taught by bestselling author Gina Clemmer using the GIS 20: Essential Skills (included in registration) as a guide.
These half day, hands-on workshops run from 9 AM / 12 EST to 2 PST / 5 EST. Each workshop is taught online, by a live instructor. Students dial in to a conference call and login from any computer to view the screen share. The interactive class makes it easy for students to ask questions and participate in group discussions. The cost is $495.
► The workshop: Focuses on teaching the fundamentals of using a Geographic Information System (GIS) for community analysis and mapping. Participants will learn how to create basic reference maps, color shaded maps and geocoded maps (address mapping).
► Upcoming Dates: Visit https://thegis20.com to sign up.
Thursday, September 26th
Thursday, October 10th
Thursday, November 14th
► Materials: The GIS 20: Essential Skills, Third Edition is included with your registration. The book is currently in the top ten Cartography books on Amazon and is the only ESRI book in the Library of Congress. It will be used for exercises and class discussion. The book includes a six month version of the software.
► Instructor: The class is taught by Gina Clemmer, bestselling author and GIS expert.
► Praise: Class participants consistently give the workshop the highest rank. Students appreciate the direct teaching method which offers a fast and comprehensive learning experience.
“Great materials, great instructor and great organization. Thanks!” – Institute for Health Research and Policy, University of Illinois at Chicago
“I especially liked the comprehensiveness of the course as well as the 2-hour segments of learning. Breaking up the learning really helped me retain what I learned. I have taken many IT trainings, but I have to say that Gina Clemmer is one of the best instructors I’ve ever had. I recommend this training to anyone that is interested in learning or improving their GIS skills.” GIS Project Coordinator, NYS Council on Children and Families
“I knew I needed to learn geo-analysis skills and I had to start somewhere. The GIS Essentials course was just the right level to get me where I needed to go. Starting with the basics, working through real-life examples, and upping the complexity made it worth my time. I also appreciated being able to ask questions specific to the projects I was working on. ” Research Data Analyst, Stanford University, School of Medicine
Looking for GIS data from the feds? You are probably familiar with data websites and portals such as The National Map, the USDA’s Geospatial Data Gateway, and geospatial data within Data.gov and the GeoPlatform. Check out this article that explores online sources whose data sets are lesser-known, starting with the U.S. Department of Housing and Urban Development.
You fly a drone? Then you must be familiar with LAANC, the Low Altitude Authorization and Notification Capability. It provides drone pilots with access to controlled airspace at or below 400 feet. Included is an FAA web app that provides near real-time authorization to conduct drone flights in controlled airspace. Drone pilots can use it to easily locate LAANC enabled airports, understand the airspace classification, determine the latitude/longitude of the proposed flight location, and view altitude restriction grids. Apps such as FAADroneZone, AirMap, Aeronyde, Converge, Kittyhawk, Skyward, and UASidekick will provide the map and the ability to acquire LAANC authorizations.
The web map is also available to the public. Check it out!

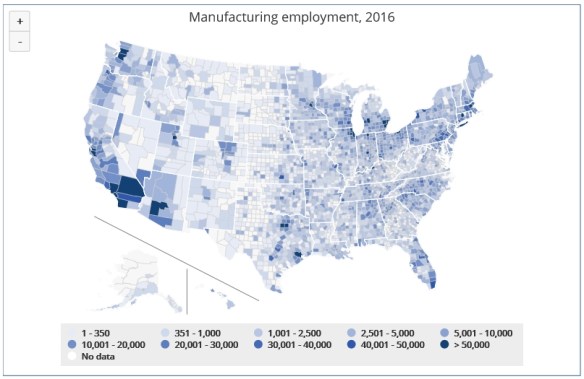
Found this interesting website about a new report examining about how the geography of US employment in manufacturing and other industries has changed over approximately the past 75 years. This report found that “the manufacturing industry has lost ground in many places across the US and is now the largest employer in only two states–Indiana and Wisconsin.”
Check out the interactive visualizations and maps. The first two visualizations allow you to explore shifts in employment and economic output trends from 1940 to 2016 for a variety of industries at both the national and state level. The other three visualizations focus on changes in the manufacturing industry in more recent decades and include data down to the county level. You can also download the full 56-page report. Check it out!
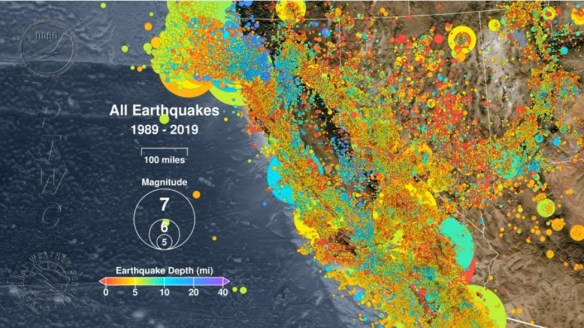
A new video from the Pacific Tsunami Warning Center maps every earthquake recorded in California in the last 30 years. Check it out below.
The video starts in August 1989 and ends July 5, 2019 with the magnitude 7.1 quake in Ridgecrest. The largest earthquake in the last 30 years was the magnitude 7.3 quake in the small Mojave Desert town of Landers in June 1992.
There is a composite image at the end of the video of all earthquakes, and really there are only a few areas in California that are earthquake free!
To give you the opportunity to demonstrate your skills using this next generation story builder, ESRI invites you to enter the 2019 StoryMapper of the Year Contest. The contest will also give you the chance to give back to your community at the same time!
The StoryMapper of the Year Contest started July 8, 2019, and the deadline for submission is 5:00 p.m. (PDT), September 30, 2019. The contest submissions must be created using ArcGIS StoryMaps, not classic ESRI Story Maps apps.
The 2019 contest will work differently than contests in years past. To up the ante, ESRI added a monetary prize and community element. When participants submit their entries, they will also describe how they would use a $5,000 donation from ESRI to make a positive impact on their communities through storytelling.
The winners will be announced by ESRI president Jack Dangermond on November 13, 2019, which is GIS Day. Good Luck!
Landsat data has been free and open since 2008. In 2017 there was a request from the Department of the Interior that the USGS consider the possibility of fee recovery for Landsat data. The Landsat Advisory Committee (LAG) took up the task to review it. Their analysis focused on three cost-sharing approaches: charging for traditional data, charging for value added products and services, and private-public partnership (P3) structures.
The LAG has finally released their findings in a report, “Evaluation of a Range of Landsat Data Cost Sharing Models”. Spoiler alert: the committee did not recommend charging for Landsat 8 and 9 data stating, “The LAG believes that charging a fee for Landsat data will generate little net revenue.” They note that doing so would “result in negative economic impacts to the U.S. commercial remote sensing satellite and value-added industries.” Laws and regulations would need to be changed in order charge for data and that the revenue gained would not be worth the economic, legal, societal or political costs.
For more info and to view the report click here.
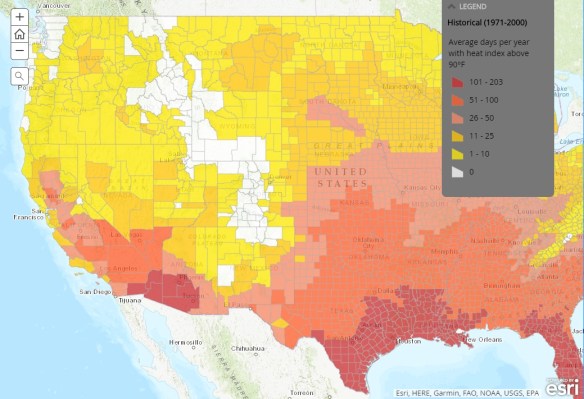
Check out this interactive story map about possible dangerous heat over the next few decades. Data from the Union of Concerned Scientists.