Every California Earthquake of the Last 30 Years

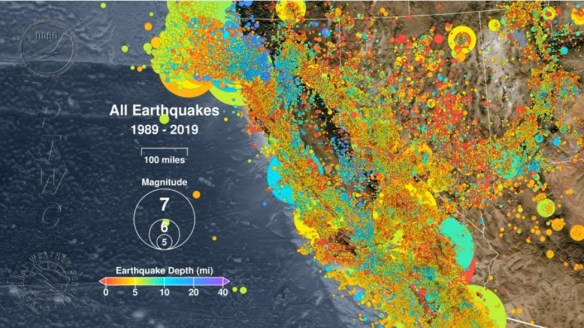
A new video from the Pacific Tsunami Warning Center maps every earthquake recorded in California in the last 30 years.  Check it out below.

The video starts in August 1989 and ends July 5, 2019 with the magnitude 7.1 quake in Ridgecrest.  The largest earthquake in the last 30 years was the magnitude 7.3 quake in the small Mojave Desert town of Landers in June 1992.

There is a composite image at the end of the video of all earthquakes, and really there are only a few areas in California that are earthquake free!
calearthquakes


2019 StoryMapper of the Year Contest

To give you the opportunity to demonstrate your skills using this next generation story builder, ESRI invites you to enter the 2019 StoryMapper of the Year Contest. The contest will also give you the chance to give back to your community at the same time!

The StoryMapper of the Year Contest started July 8, 2019, and the deadline for submission is 5:00 p.m. (PDT), September 30, 2019.  The contest submissions must be created using ArcGIS StoryMaps, not classic ESRI Story Maps apps.

The 2019 contest will work differently than contests in years past. To up the ante, ESRI added a monetary prize and community element.  When participants submit their entries, they will also describe how they would use a $5,000 donation from ESRI to make a positive impact on their communities through storytelling.

The winners will be announced by ESRI president Jack Dangermond on November 13, 2019, which is GIS Day.  Good Luck!

Charging for Landsat Data?

Landsat data has been free and open since 2008.  In 2017 there was a request from the Department of the Interior that the USGS consider the possibility of fee recovery for Landsat data.  The Landsat Advisory Committee (LAG) took up the task to review it.  Their analysis focused on three cost-sharing approaches: charging for traditional data, charging for value added products and services, and private-public partnership (P3) structures.

The LAG has finally released their findings in a report, “Evaluation of a Range of Landsat Data Cost Sharing Models”.  Spoiler alert: the committee did not recommend charging for Landsat 8 and 9 data stating, “The LAG believes that charging a fee for Landsat data will generate little net revenue.”  They note that doing so would “result in negative economic impacts to the U.S. commercial remote sensing satellite and value-added industries.” Laws and regulations would need to be changed in order charge for data and that the revenue gained would not be worth the economic, legal, societal or political costs.

For more info and to view the report click here.

Fireworks 2019!

July 4th is just around the corner, which means there will be fireworks again!

Use the app to view cities in LA, Orange, Ventura, Riverside, and San Bernardino County that allow the sale and discharge of fireworks.  Included are days and times when fireworks will be sold and when you can light them up, as well as links to city websites and telephone numbers.  Data was collected from municipal codes, websites, and/or contacting each city.  Some cities allow sales to start today AND allow you to discharge them today as well!  Check it out!

fireworks2019

Calculating Slope Using Python

The standard slope tool in ArcGIS Desktop only examines a 3×3 cell neighborhood (and does not include the center cell) to determine slope for each cell.  However, using Python you can create a method for calculating slope along a flow direction grid specific to your needs.  Check out this article about using Python to calculate a fire “flow direction” based on a DEM and fire lines.

slopepython