Looking for that perfect Christmas gift for a map aficionado? Check out these ideas in the 2019 Holiday Gift Guide.
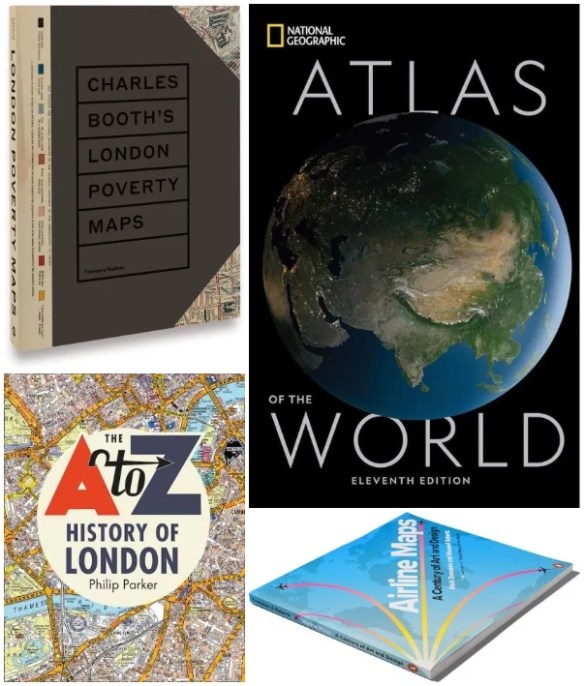

Looking for that perfect Christmas gift for a map aficionado? Check out these ideas in the 2019 Holiday Gift Guide.
Click below to check out data and maps about individual meal items you find during Thanksgiving dinner. Have a happy Thanksgiving!

ESRI’s ArcGIS Living Atlas of the World can be described as an evolving collection of authoritative, curated, read-to-use global geographic information curated by ESRI and the GIS user community. It includes imagery, basemaps, demographics and lifestyle, landscape, boundaries and places, transportation, earth observations, urban systems, oceans, and historical maps, all of which can be combined with your own data.
Most can be used without signing in, but you will need an ArcGIS Online account for the more interesting ones. Here are a few I found that were interesting. Continue reading
There are some ArcGIS users that export their maps to an Adobe format so a graphic artist can finish it up. Now inside Adobe Photoshop and Illustrator you can import data-driven maps with ArcGIS Maps for Adobe Creative Cloud. Check out the video below and read the Seattle Times case study.
Reminds me of my digitizing days!
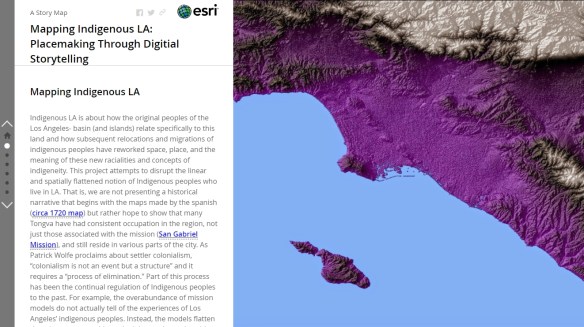
The Mapping Indigenous Los Angeles project from the University of California Los Angeles is creating a series of story maps that bring together a variety of stakeholders to help highlight “multiple layers” of diversity and identity. At the heart of the site are the story maps themselves, which unfold to reveal the complex history of place and the Indigenous peoples who have helped shape and been shaped by them. The story maps vary in length and depth, but all feature a variety of text, photos, podcasts, and other materials that help viewers immerse themselves in the subject matter and deepen their understanding. Check it out!
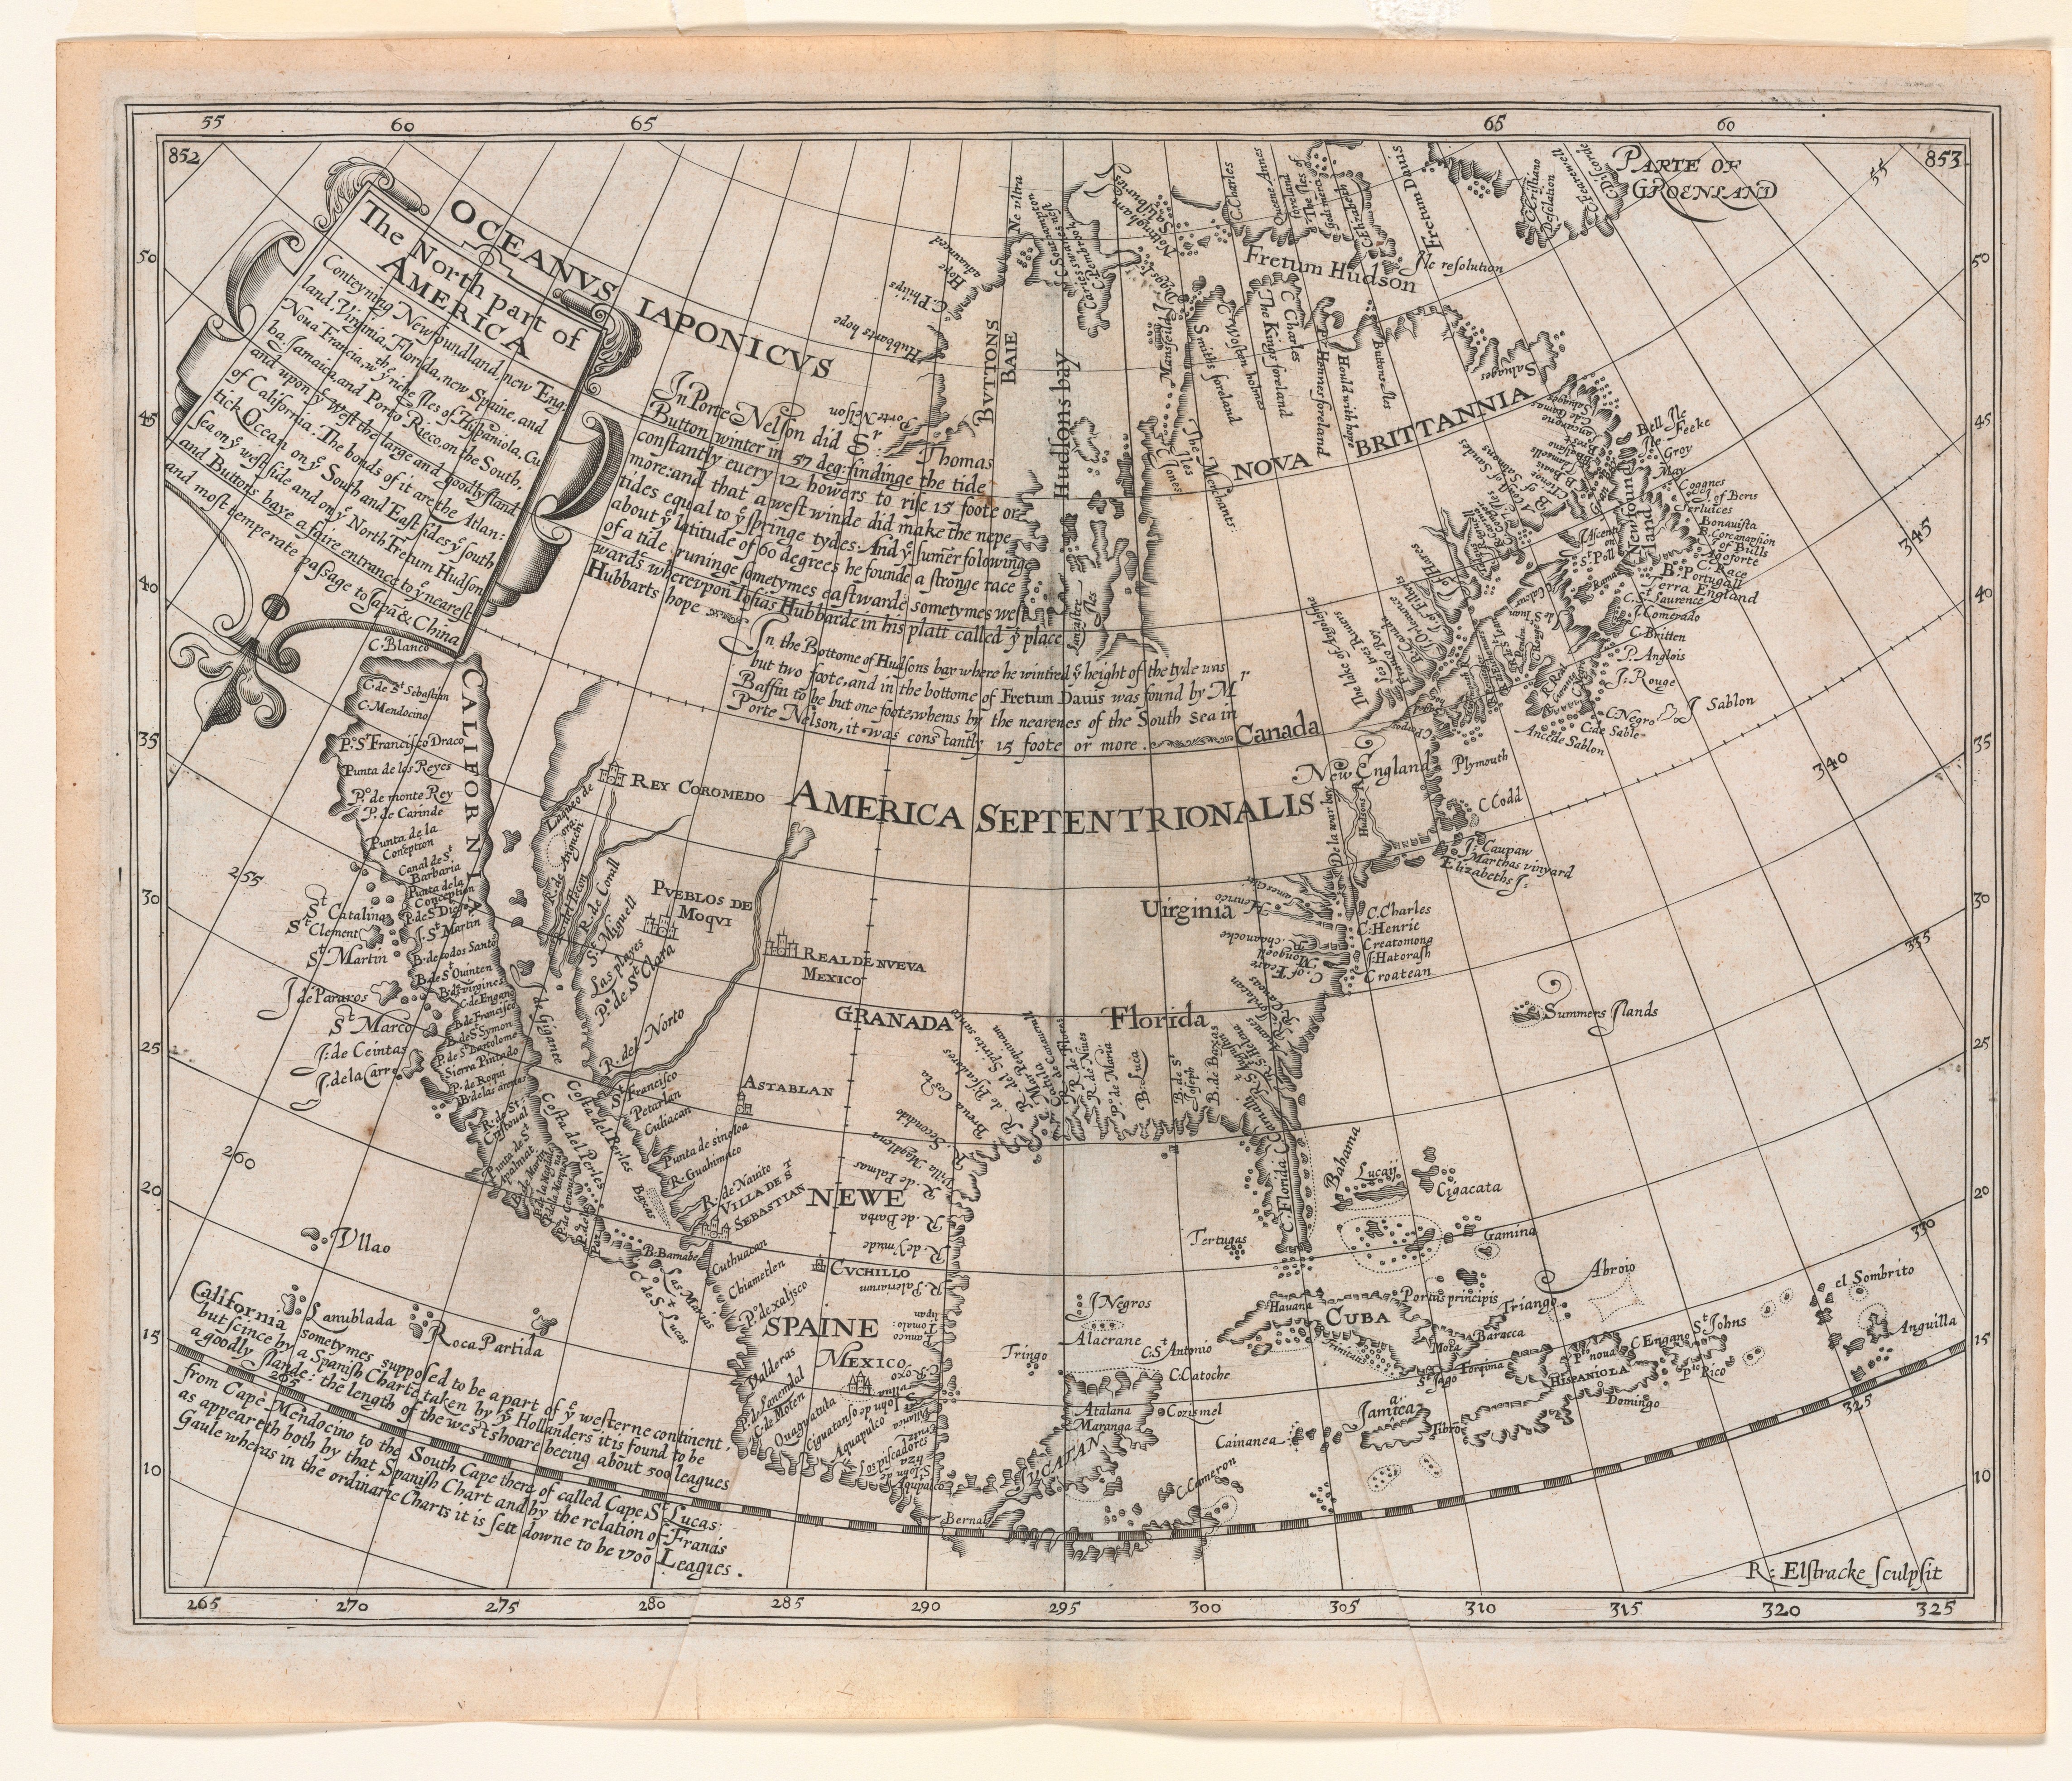 This 1625 map by British mathematician Henry Briggs initiated one of the most famous of all cartographic misconceptions, California as an island, which persisted until the end of the 17th century. This idea is thought to have originated with the Carmelite friar, Antonio de la Ascension who accompanied Sebastian Vizcaino on his West Coast expedition of 1602-03, and wrote an account of the trip. About 1620, it is believed that Father Ascension drew a map depicting California as an island and dispatched it by ship to Spain. The ship was captured by the Dutch and the chart taken to Amsterdam.
In 1622, California appeared as an island on two title page vignettes published in Amsterdam by Michiel Colijon: Jacob le Maire’s Spieghel Der Australische Navigatie and Antonio de Herrera’s Descriptio Indw Occidentalis. That same year in London, Henry Briggs published an article entitled “A treatise of the Northwest Passage to the South Sea, through the Continent of Virginia, and by Fretum Hudson.” Briggs claimed to have seen a map in London brought from Holland showing California as an island. His article was republished slightly modified in 1625 in Purchas’ Pilgrimes, and was accompanied by this map supposedly drawn from the one “taken by Hollanders.” A similar map engraved by Abraham Goos was inserted into a small book published in 1624 in Amsterdam. Although dated earlier, it is likely that this map used the Briggs map as a source.
Briggs’ map quickly became a model for others. John Speed copied it in 1626-7 as did Joannes Jansson in 1638, and soon nearly all European cartographers depicted California as an island. One purpose of the map was to suggest the probability of a short passage from Hudson Bay to the Pacific Ocean, which was enhanced cartographically by the absence of a northern coast and land to the west, which were common features of maps up to that time.
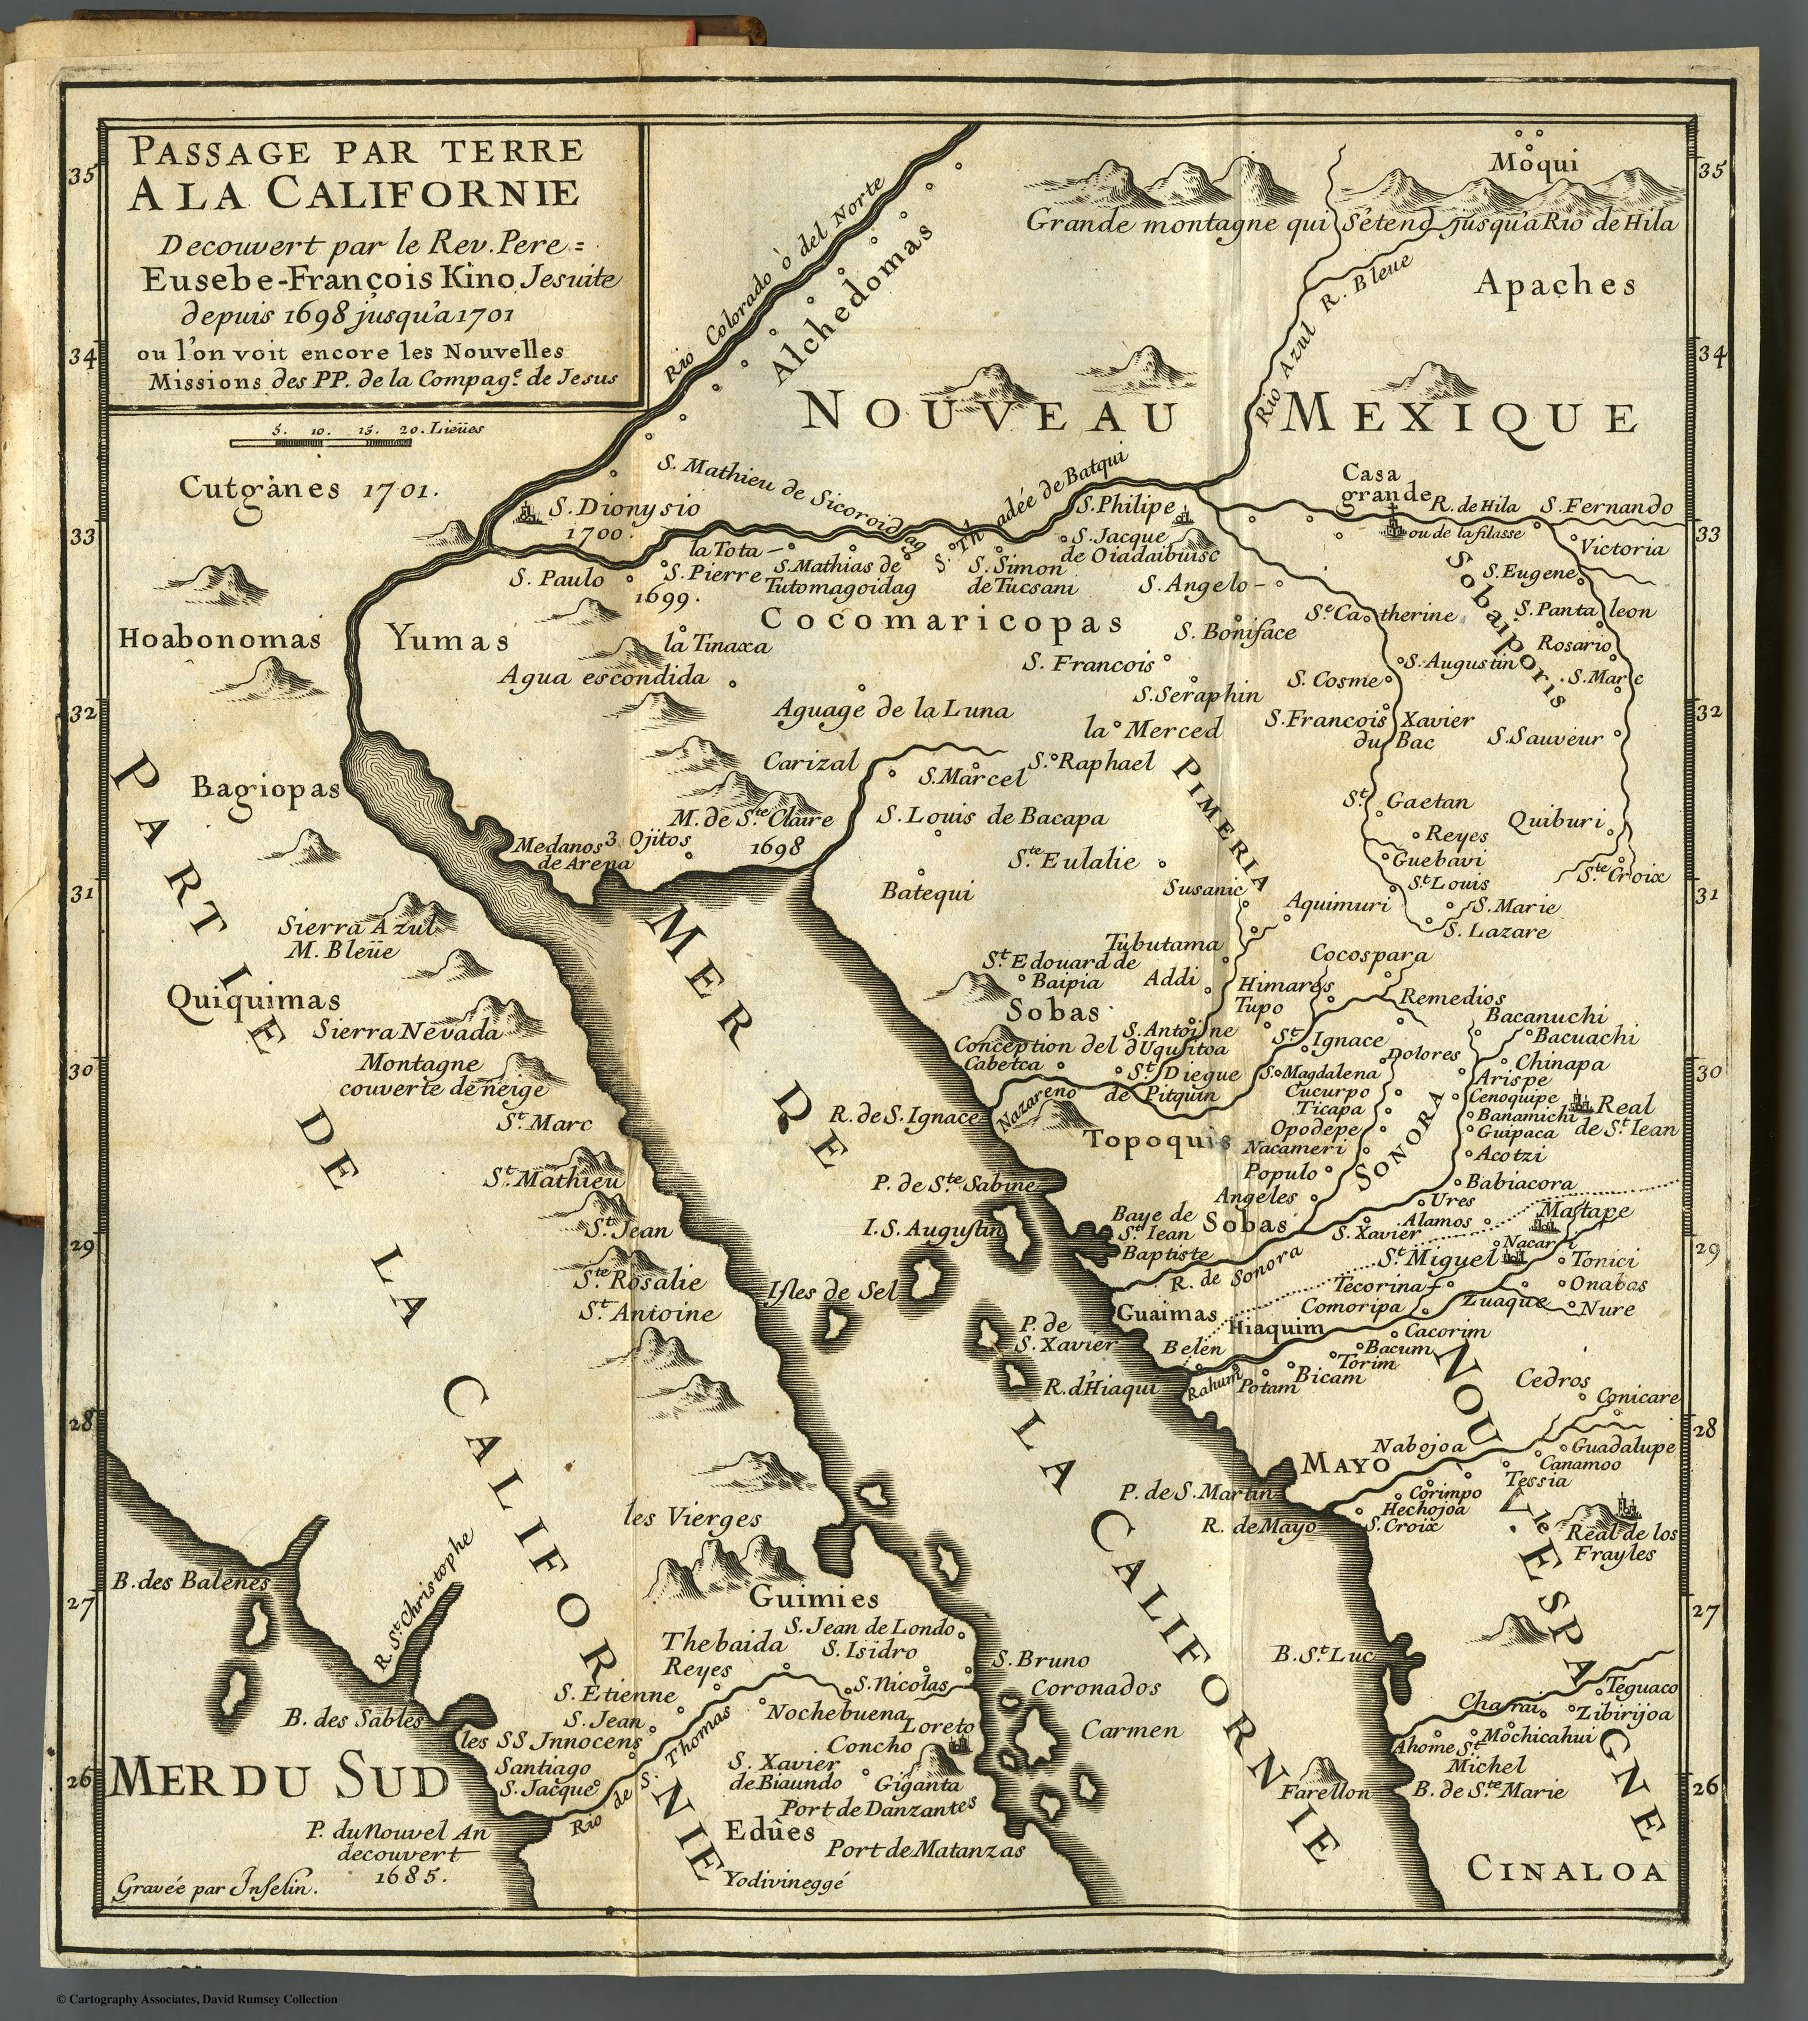 A Jesuit friar, Eusebio Kino, was the first to offer proof against the island theory using the map he compiled in 1701, which was printed in 1705 in Paris. Kino’s map was not readily accepted and it eventually required a royal decree by Ferdinand VII of Spain in 1747 to state that “California is not an Island.”
(text from CaliforniaMapSociety.org)
Hema Maps. California, Nevada road guide. 1 map, scale 1:1,000,000. Hallwag, pub. 2019. ISBN: 9783828307568
Michelin North America. Streetwise California: state road map of California. 1 map, scale 1: 2,400,000. Greenville, S.C.: Michein Travel, pub. 2019. ISBN: 9782067238824
National Geographic Maps. Desolation and Granite Chief Wilderness Areas. 1 map, scale 1:40,000. Evergreen, Colo.: National Geographic Partners, Trails Illustrated topographic map 802, pub. 2018. ISBN: 9781566957731
National Geographic Maps. Tahoe Rim Trail. 1 map, scale 1:63,360. Evergreen, Colo.: National Geographic Partners, Trails Illustrated topographic map 1013, pub. 2018. ISBN: 9781566957496
U.S. Bureau of Land Management. Alabama Hills recreational and scenic area, map and guide. 1 map, scale ca. 1:10,480. Bishop, Calif.: Bureau of Land Management, Bishop Filed Office, pub. 2018. Link.
U.S. Bureau of Land Management. BLM routes of travel for western Imperial County, California. 1 map, scale 1:135,000. El Centro, Calif.: Bureau of Land Management, El Centro Field Office, pub. 2019. Link. Link.
U.S. Forest Service. Plumas National Forest, California. 1 map, scale 1:126,720. Vallejo, Calif.: U.S. Forest Service, pub. 2019. ISBN: 9781628114348
U.S. Forest Service. Sequoia National Forest atlas, including Giant Sequoia National Monument: 7 1/2ʹ quadrangle topographic maps. 1 atlas (60 p.), scale 1:63,360. Washington, D.C.?: U.S. Forest Service, pub. 2019. ISBN: 9781628114331
U.S. Forest Service. Shasta-Trinity National Forest atlas: 71/2′ quadrangle topographic maps. 1 atlas (119 map sheets), scale 1:63,360. Vallejo, Calif.: U.S. Forest Service, pub. 2019. ISBN: 9781628114355
Zanger Christopher. Mount Shasta Wilderness. 1 map, scale 1:38,000. Birmingham, AL: Wilderness Press, 4th edition, pub. 2017. Link.
Check out this interactive map that shows the perimeters of wildfires that have burned in California from 1878 to 2018 using data from the California Department of Forestry and Fire Protection and the U.S. Geological Survey. The wildfires are categorized by the year in which they started. Perimeter information from fires that started between 1878 and 2017 comes from Cal Fire, while information on the Thomas Fire and fires that started in 2018 comes from the USGS.

If you are like me, I get confused on how many ArcGIS Online credits are used for certain transactions. For example, if I want to generate a tile cache, that would be 1 credit per 10,000 tiles generated.
Check out this Credits by Capability table to see how many credits you would consume per transaction.
With all the fires that are going on right now, this interesting interactive map by UCLA shows all buildings in California classified by what Cal Fire Fire Hazard Severity Zone they fall in. Click below and check it out!

Thanks goes to Barry Waite for finding this one!
You can also check out the Cal Fire Fire Incident Map here.

