Fall Foliage Prediction Map 2016

What many people love most about the fall are the vibrant colors that mark the transition from summer to winter. Temperature, the amount of sunlight, and precipitation all affect how quickly the foliage will change from green to red, yellow, or orange. This interactive tool illustrates where autumn colors are peaking across the United States.

The map uses data from NOAA precipitation forecasts, daylight and temperature forecasts, historical precipitation data for this year, as well as other government and private data sources to visually indicate the foliage change between August and November, noting seven degrees of change. In addition to helping users plan a weekend getaway to enjoy fall’s many colors, the site offers some science trivia about what causes leaves to be certain colors and why leaves fall.  Check it out!

fallfoliage

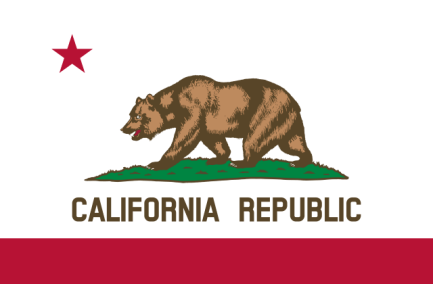
Happy Birthday California!

ca-flag-640x420

Today America’s most populous state and third largest by geographic area is 166 years young.  California became the 31st American state on September 9, 1850.

Some fun facts that you might not know about the Golden State:

  • California is home to the highest point in the continental U.S., the 14,494 foot Mt. Whitney.
  • It is also home to the lowest point in the continental U.S., Death Valley, which drops down to 282 feet below sea level.
  • The fortune cookie was invented here. At least the Americanized version. Efforts to trace its origins into the past and across the Pacific Ocean have been difficult, as documented by The New York Times and The Smithsonian.
  • California is the only state to host the Summer (1932 & 1984) and Winter Olympics (1960).
  • Our state song? “I Love You California.”

And here are some things that were going on in the world in the year 1850.

If you happen to be in Sacramento today, you can join in the festivities at the State Capital from 11am to 1pm.

1979 California Water Atlas

The California Water Atlas, published by the State of California, was a landmark atlas with the first comprehensive look at California’s extensive water system in a geographic context. The atlas itself measured about 18.5 x 16 inches and had hundreds of maps and infographics that told the story of California water in different ways.

The goal of the atlas was to “introduce Californians to the complex and compelling issues of water in the state, giving them the information they need to participate more actively in the decisions that governmental agencies make”. Continue reading

PancakeBot!

Ok, this has nothing to do with GIS, but I had to post about this one because it is too cool!

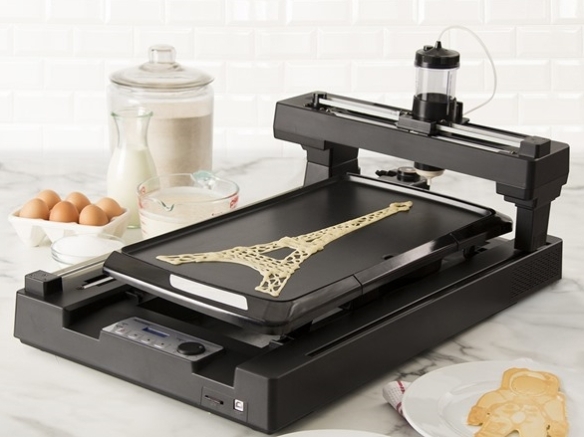
PancakeBot is a 3D food printer that takes any design using the included software and creates a pancake out of it by squirting pancake batter on a griddle.

If you act quickly TODAY, you can snag one for $199.99 on Woot.com.  Regular price is $299.99 on PancakeBot.com.  Get one now and make a map pancake!

pancakebot