This interesting interactive map makes it possible for you to click on an icon to get directions on where to sit to get the best Wi-Fi access as well as instructions for entering the password. Check it out!


This interesting interactive map makes it possible for you to click on an icon to get directions on where to sit to get the best Wi-Fi access as well as instructions for entering the password. Check it out!
I want to wish everyone a very Merry Christmas and a Happy New Year. As usual, you should check out the Christmas Map as well as The Physics of Santa Claus.
And if you are looking for something to do with the family, head on over to the new Santa’s Village in Skyforest. -mike
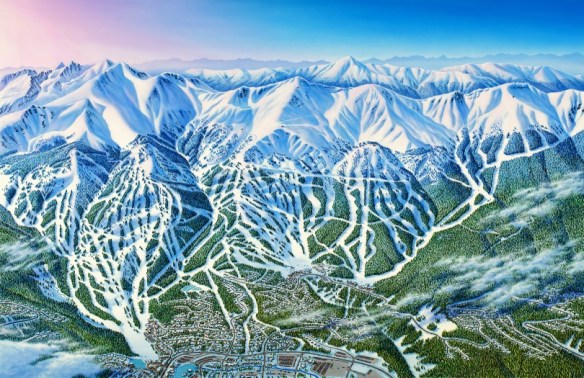
Check out this story about James Niehues, the person that hand paints all those ski resort maps that you probably have used or seen before.
Check out these maps and article about 15 fast food chains that dominate in the US.
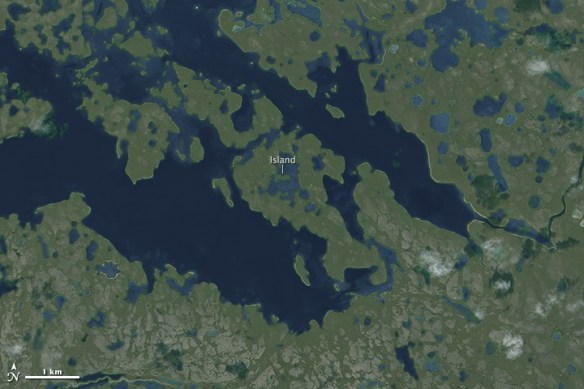
An island in a lake on and island in a lake on an island … the Canadian Arctic Archipelago is home to the world’s largest third order island. Check it out!
Here is an interesting article from the UK about how map reading seems to be a lost art. People have stopped being able to read maps in the age of automatic mapping … people are instead increasingly read by maps! Map reading should be a basic life skill and maybe we should start teaching it in schools again.

Today is GIS Day! If you are looking for a place to check out, may I suggest the GIS Day celebration at Los Angeles County. They put on a big show and have many booths and presentations.
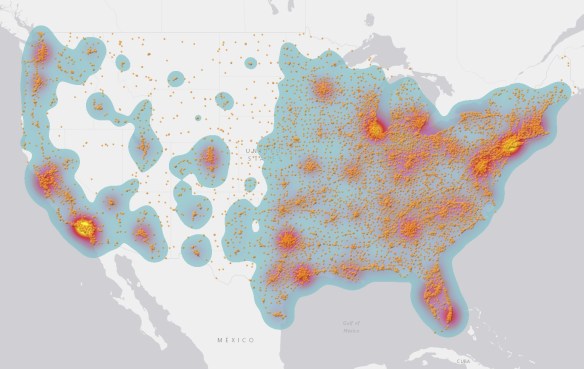
You can find other places that are celebrating GIS Day by checking out the GIS Day map below.
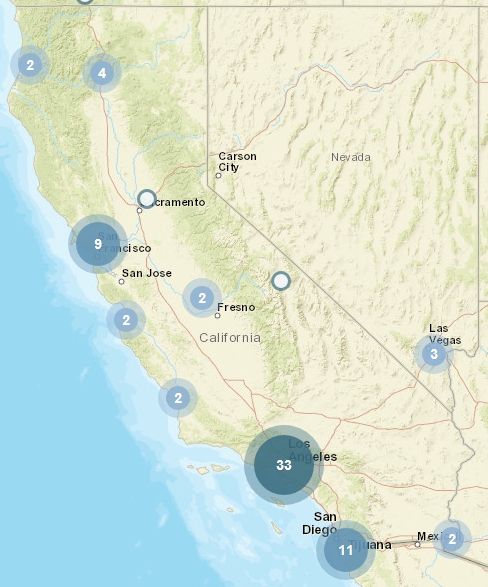
Happy GIS Day!
There once was a tiny island at the entrance to the San Pedro harbor named Dead Man’s Island, which was named for the shallow graves dug into its flat top. The small island measured at least 800 feet long and 250 wide and rose 55 feet above the sea, separated from the San Pedro bluffs with almost a mile of open water between.
As part of a program of extensive harbor improvements, Continue reading
What many people love most about the fall are the vibrant colors that mark the transition from summer to winter. Temperature, the amount of sunlight, and precipitation all affect how quickly the foliage will change from green to red, yellow, or orange. This interactive tool illustrates where autumn colors are peaking across the United States.
The map uses data from NOAA precipitation forecasts, daylight and temperature forecasts, historical precipitation data for this year, as well as other government and private data sources to visually indicate the foliage change between August and November, noting seven degrees of change. In addition to helping users plan a weekend getaway to enjoy fall’s many colors, the site offers some science trivia about what causes leaves to be certain colors and why leaves fall. Check it out!

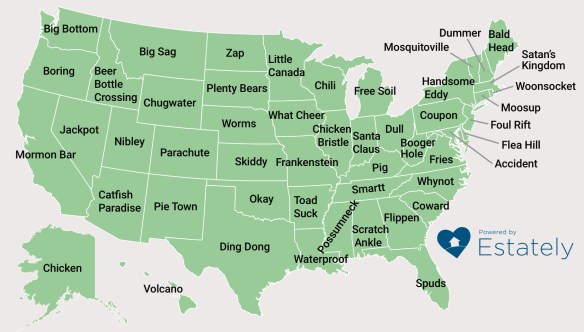
Check out this map and article about unusually named towns in the United States. You know you want to visit them on your next road trip!