Love maps and want to save California’s wild spaces? This site is for you!
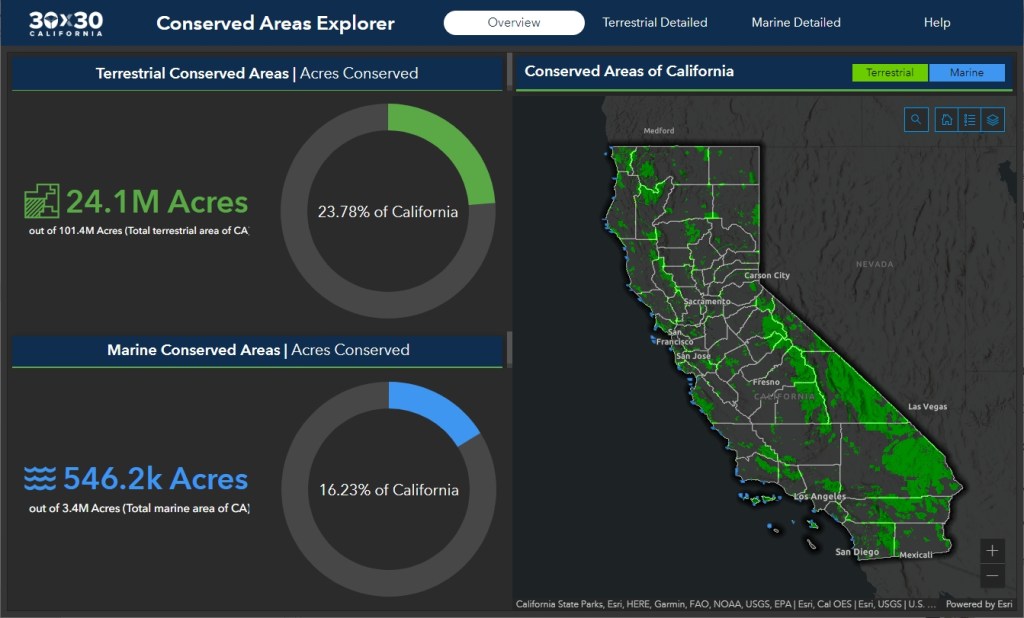
California is making plans to protect 30% of its lands and coastal waters by 2030 (called 30×30). And with it is a new mapping tool to support their “30×30″ goal.
The CA Nature website allows you to explore the landscape and consider which areas you might want to see protected in the future. The site’s “conserved areas explorer” shows the 24.1 million acres that are already conserved, many of them as parks, forests, and preserves. Other interactive maps show which lands and waters offer the greatest biodiversity, and how rising temperatures and changing rainfall patterns are expected to alter the state’s landscapes. Check it out!
Usually April 15th is when our taxes are due, but not this year. Due to a holiday in Washington DC today, Emancipation Day, our taxes will be due on Monday the 18th.
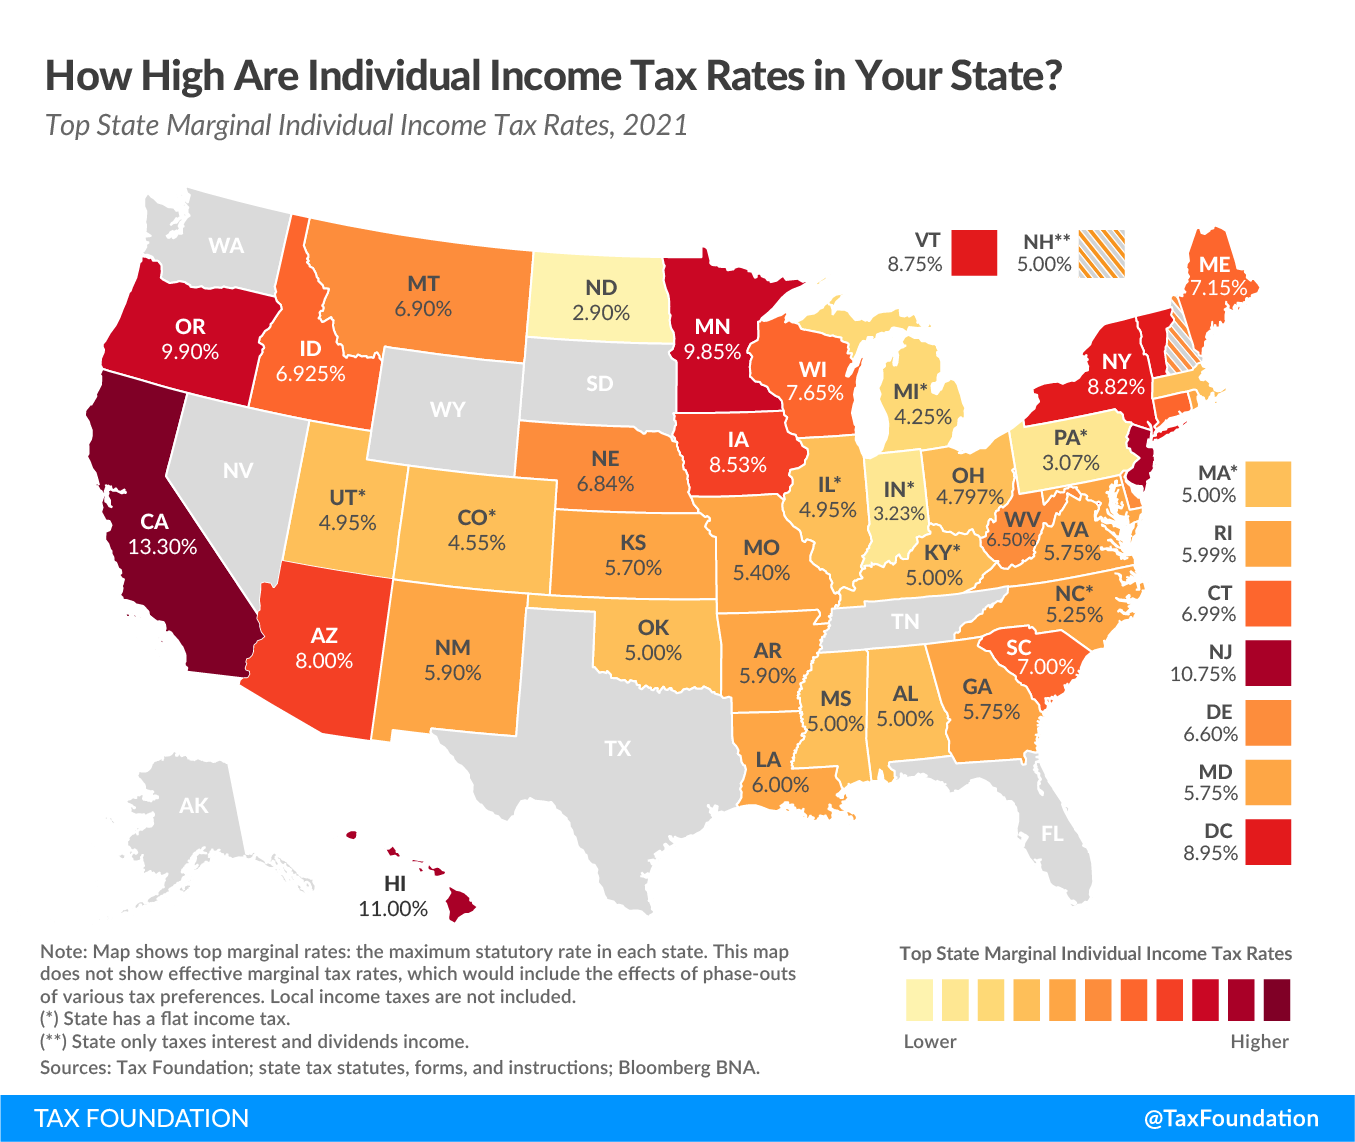
Which brings up a question, which states pay the highest tax rates? Check out the map below:
Unfortunately California is the highest … probably not a good idea to retire in California! Note that Tennessee has joined seven other states that do not levy any individual income tax. Also note there are 10 states that have flat income tax. Click here for more info.
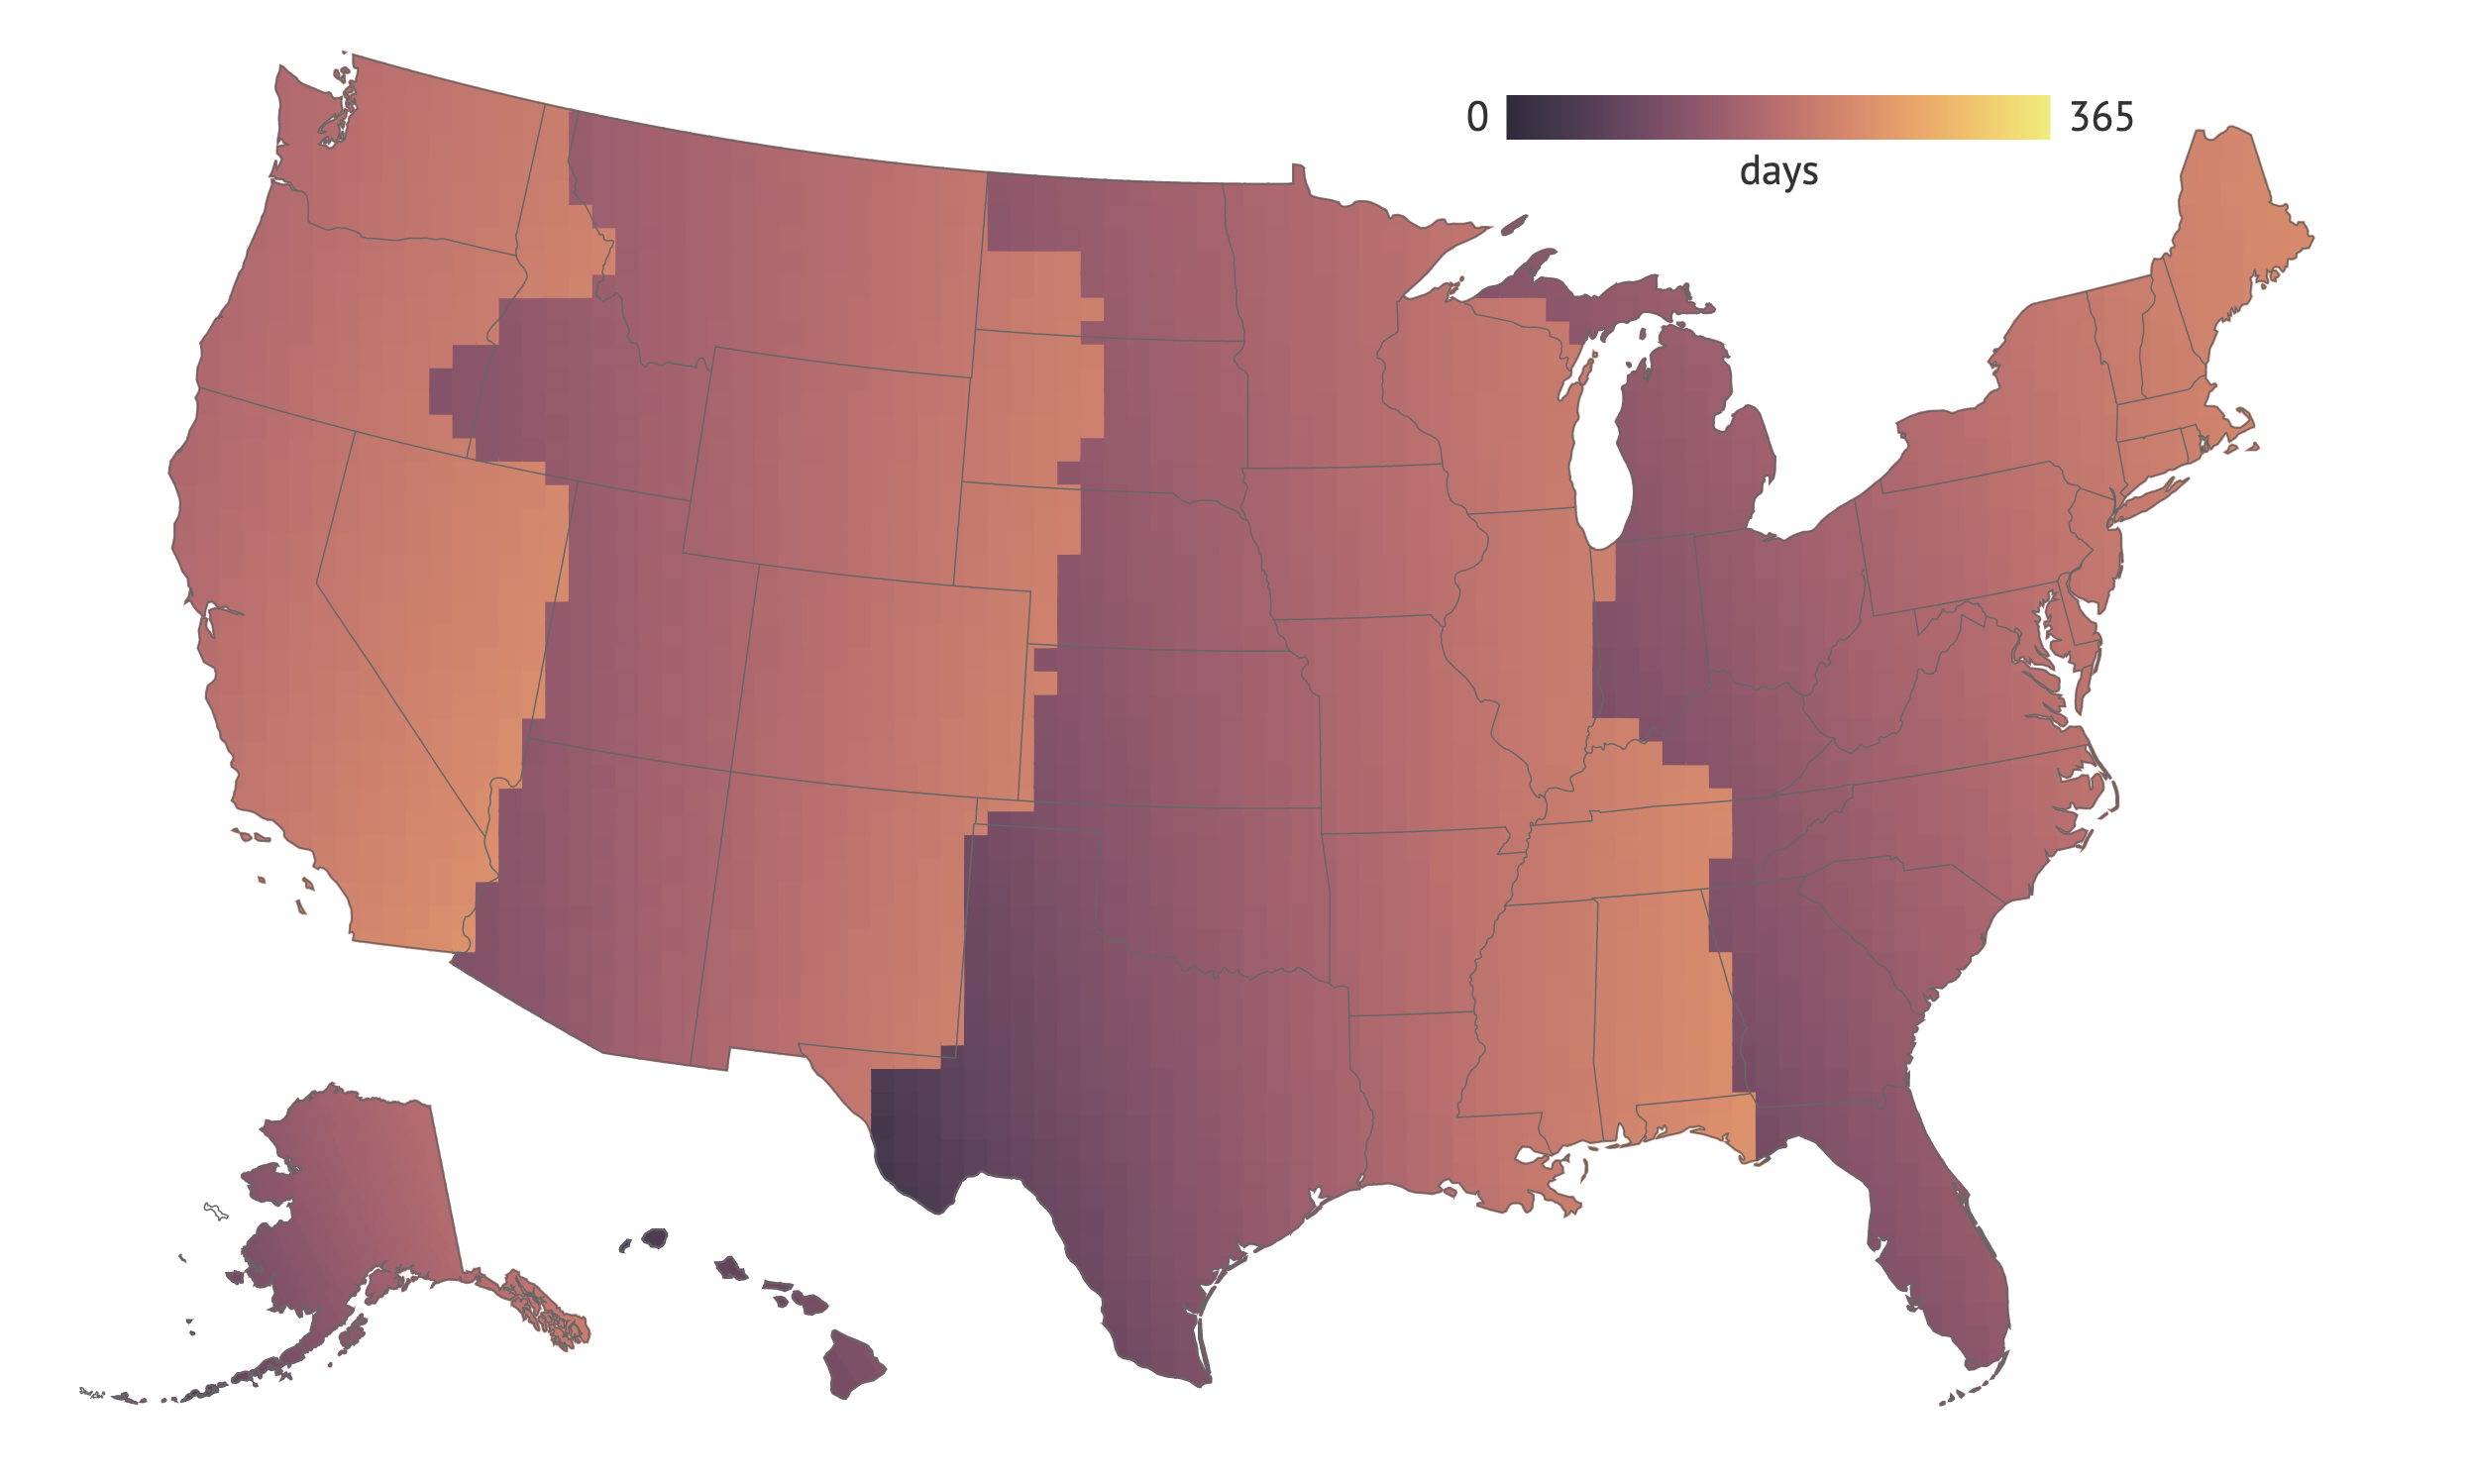
Provided by NASA, the POWER Data Access Viewer contains geospatially enabled meteorology and solar related parameters formulated for assessing and designing renewable energy systems. Access daily averaged data for specific date ranges and parameters for a single site. View interactive charts, data tables, and download various tabular and geospatial file formats. You can also access climatology ½ x ½ degree datasets for the entire globe and generate custom climatological reports and data by single point. Check it out!
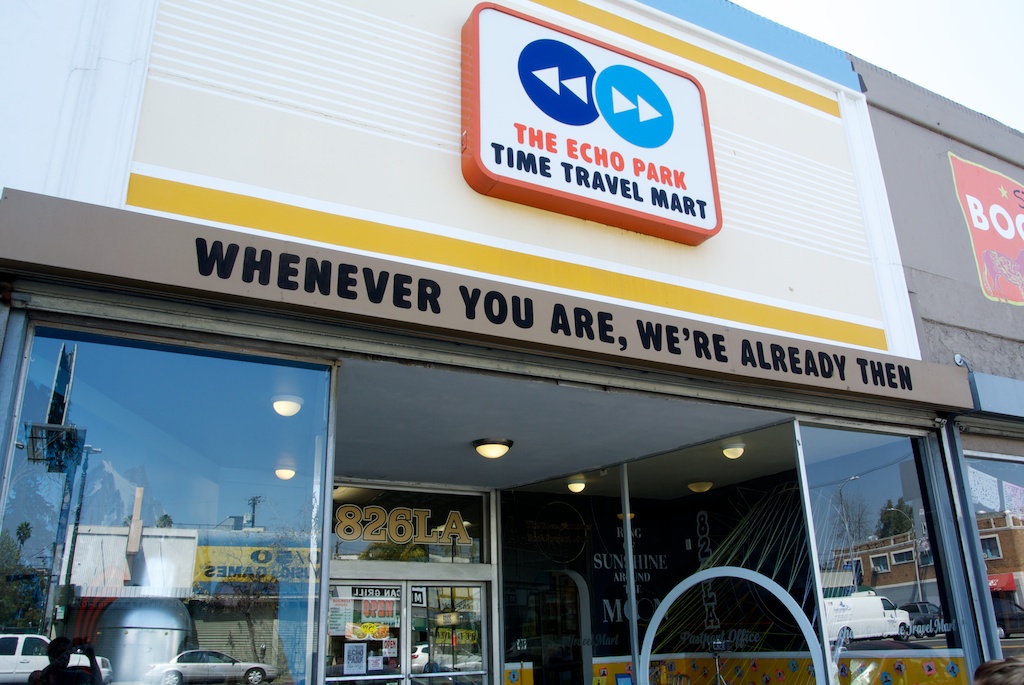
If you are a time traveler, then you probably know about the Time Travel Mart in Echo Park … and you already read this post!
When you walk in, you might be greeted by a man behind the counter who will say “hello again, I saw your future self in the store today, they told me you would be coming in.” Ha!
Go visit the store. They are the purveyor of quality goods from the past, present, and future. The aisles are broken down into different time periods. You can check out dinosaur stuff, robot milk, ray guns, etc. You can even buy a shade tree … instructions state “take the seed, travel back in time, plant it, return to the present and relax under your tree.” Or maybe a “What happens in La Brea tar pits stays in La Brea tar pits” T-shirt? There is something for every time traveler!
And here is the best part. The store itself is part of 826LA, a non-profit organization dedicated to supporting students ages 6 to 18 with their creative and expository writing skills, and to helping teachers inspire their students to write. 826LA specializes in after-school tutoring, workshops, and programs. The kids are encouraged to be creative, and once a month, one of their stories gets published and put into the store for people to purchase.
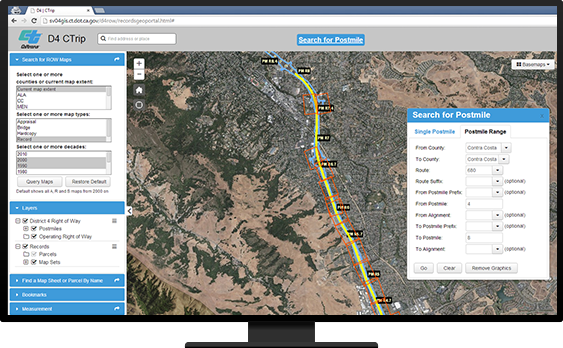
If you deal with projects in the right-of-way, why not use GIS to manage them? GIS can improve project planning by delivering integrated project and basemap data and information to all stakeholders. GIS adds new ways to collect, organize and manage ownership records, deeds, surveys, projects plans and more. GIS enables high accuracy data collection reducing visits to the field. GIS reduces costs, improves public engagement, and increases project efficiencies. GIS delivers a framework for better decision making.
It’s a miracle right? All kidding aside, check out these ArcGIS solutions to map and monitor your roads and highways.
Well, they did it. The US Senate passed a bill this week to make DST permanent by November 2023, except for states that do not observe DST … good for you Arizona and Hawaii!
The bill now has to pass in the House. If it does, enjoy the darkness in the winter months if you live near the western portion of your time zone! Here is a nice quote:
“Not many people have experienced daylight saving time during the winter, except for some during an experiment — which failed.”
Click the map below to read all about it. Check out the nice maps too!
Thanks goes to Bonnie at Manhattan Beach for finding this article!
One-Year MS in GIS @ CSULB – Apply Now for Fall 2022!
Geospatial is everywhere. Develop your geospatial skills through a Master of Science in Geographic Information Science (MSGISci) at California State University Long Beach (CSULB).
The MSGISci is a 1-year, 30-unit MS degree program offered through the Department of Geography. Classes are scheduled on weeknights and weekends to accommodate working professionals. Please visit http://www.beachgis.com for program details, application instructions, and to sign up for an upcoming information session. Join our network of over 100 program graduates by summer 2023!
Applications will be reviewed on a rolling basis and will be accepted until June 1st for domestic applicants and April 1st for international students.
Looking to liven up your ArcGIS Online maps? Try out some feature specific effects that allow you to emphasize some features in a layer with interesting effects. Check it out!