
The United States is experiencing the fourth wave of COVID-19 infections, due to the Delta variant of the virus. The mutation with a coinciding spike in cases was expected, but the rampant nature of the spread across the country poses many questions. First and foremost is, Where do I need to be especially careful?
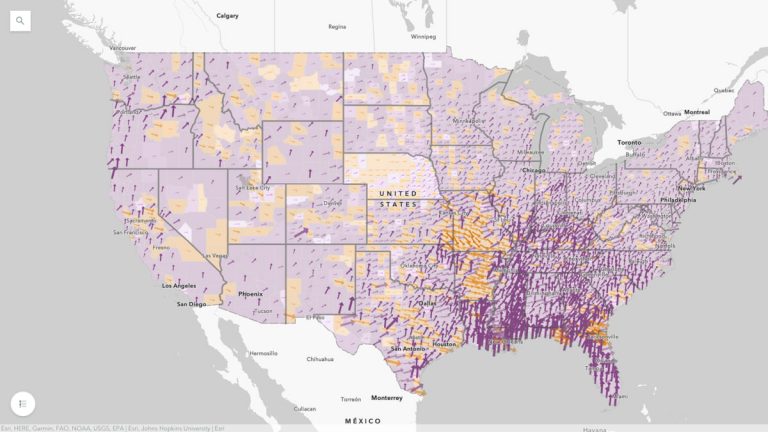
The interactive map “Which Way Are Things Going?” gives a county-by-county view of active cases for a week-by-week perspective on COVID-19 trends. The map aims to provide accurate and actionable information for everyone, with data from state level to county level that makes it easy for anyone to zoom in and see the trends that will help them make decisions about when and where to better safeguard their health and that of their family.
Click below to view the story map.
By the way, the source map is also available in ArcGIS Living Atlas for your use in your own apps, dashboards and story maps.
