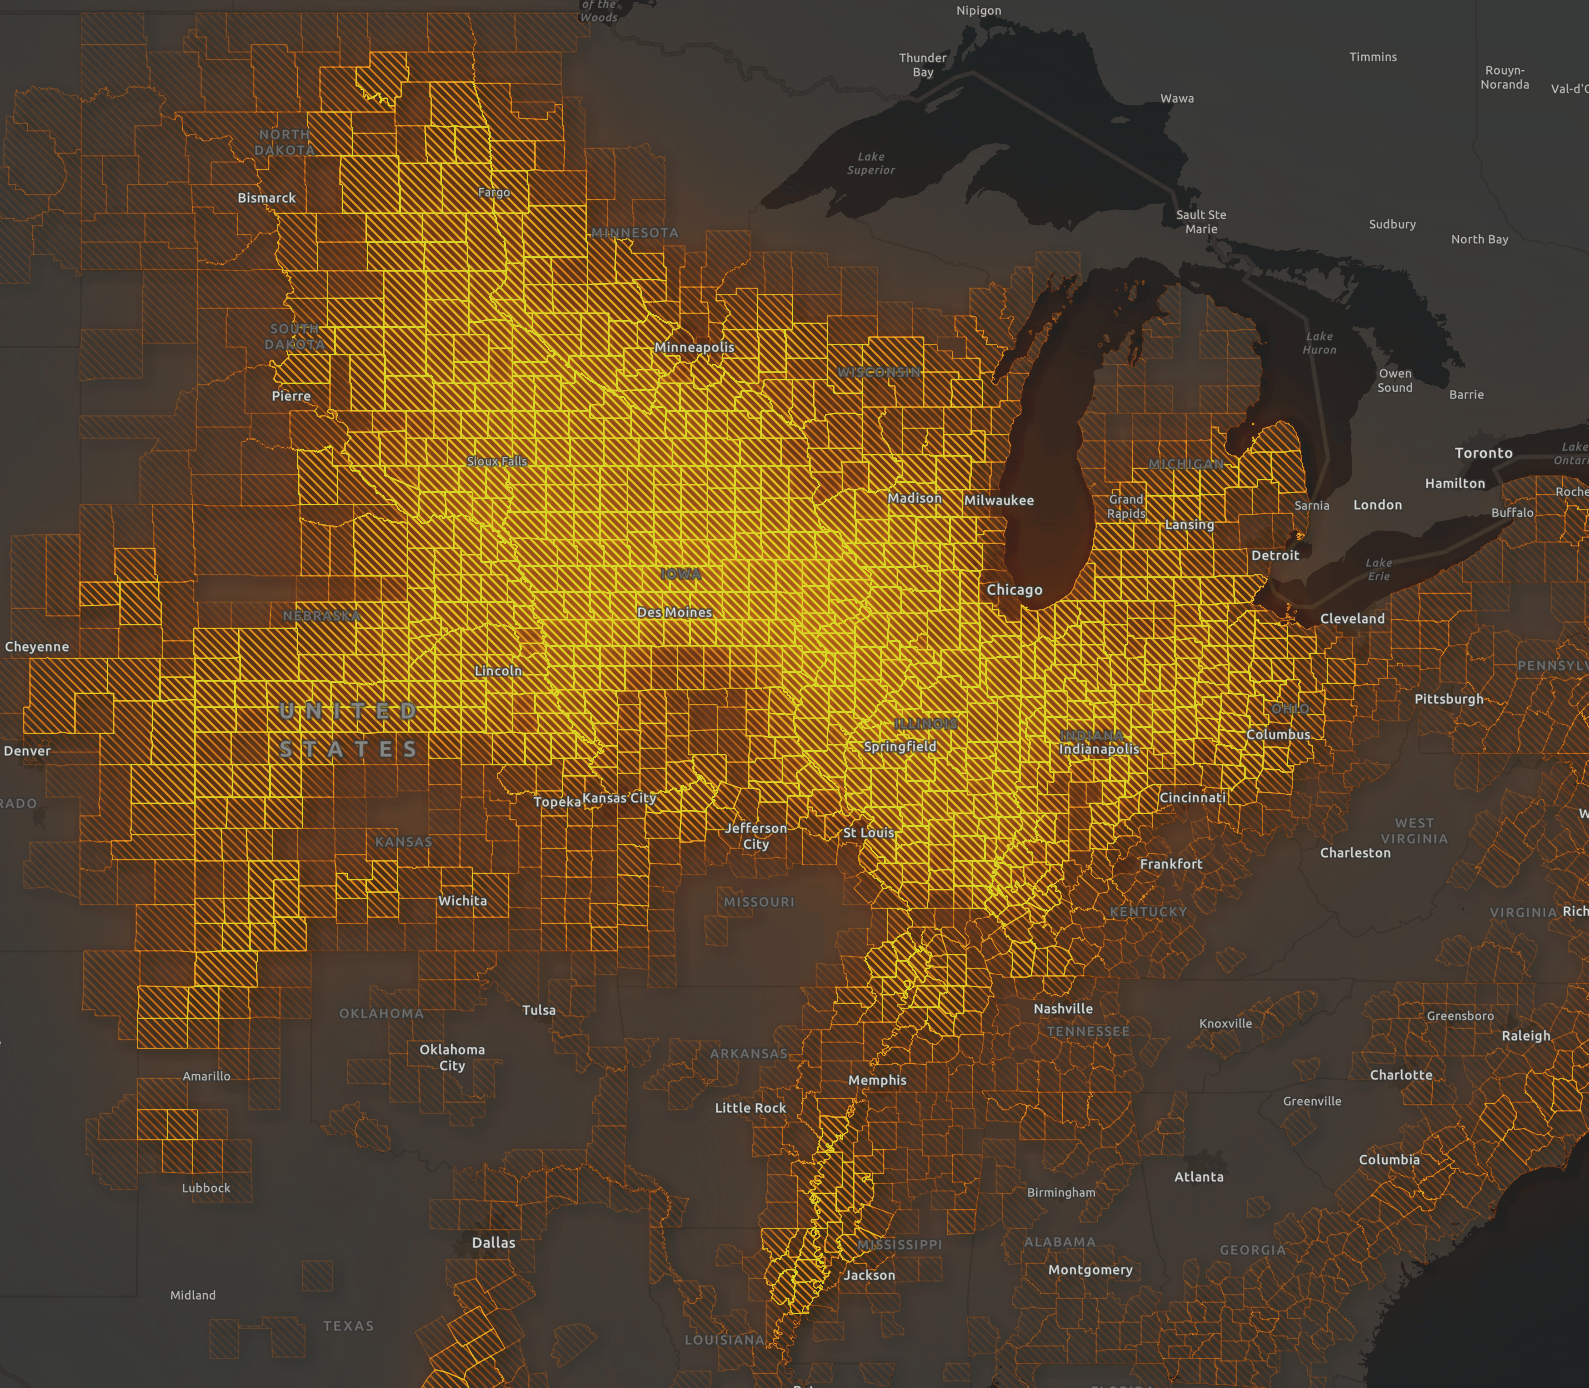
The National Audubon Society has a new interactive map that combines bird distribution and migration maps with conservation data for 458 species of migratory birds. The interactive map displays its information from hemispheric to local levels. Check it out!
Most of us deal with GIS in government, and thus probably never get to use GIS outside of that, like managing a vineyard!
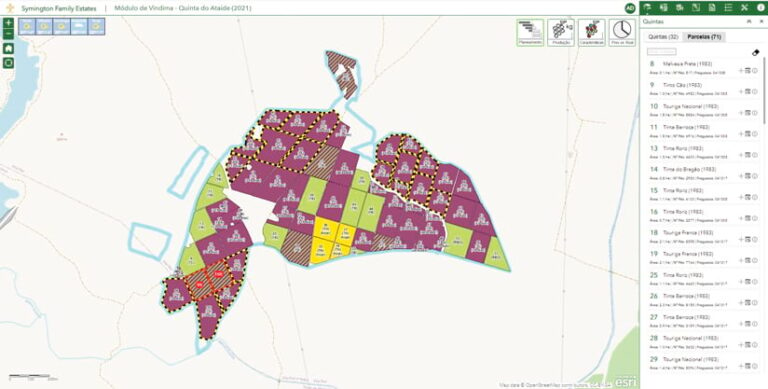
If you at least enjoy wine, you will find this article interesting as one family owned vineyard switches over to GIS so they can be more efficient in managing 2,500 acres of land and grape harvesting. Some of the GIS technology they use includes ArcGIS Enterprise, Survey123, and other components. Check it out!
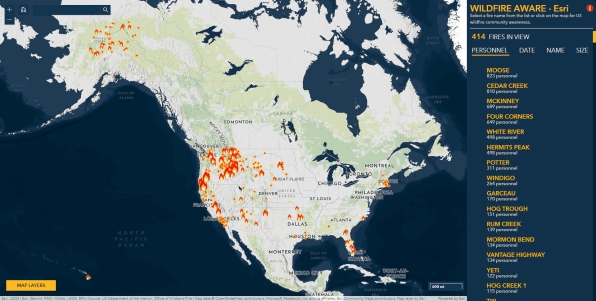
As wildfire season heads into its peak in late summer and early fall along the west coast, web cartographers at ESRI have created a new Wildfire Aware interactive mapping app. The app tracks wildfires across the country and reports on their impact to people, property, and the natural world. The app includes data from different agencies, including the Environmental Protection Agency (EPA), NASA, the National Weather Service, the U.S. Census, and the U.S. Fish and Wildlife Service. For each fire, you can scroll through data that shows how long the fire has been burning, how much acreage it has burned, how many personnel have been deployed, and what percent contained it is, as well as other data including what type of landform it covers, how much biodiversity is present, and how much carbon could be lost. Check it out!
If you have a need to quickly collect data while out in the field, check out this webinar about ESRI’s QuickCapture software product. See how easy it is to incorporate rapid data collection at your organization.
For more info and to requester, click here. The webinar is on September 14 at 9am PDT.
ESRI has a webinar that explores addressing challenges associated with gathering, filtering, and leveraging a myriad of threat and risk data feeds and then disseminating threat information and alert stakeholders of issues.
The USGS National Geospatial Program is again updating the US Interagency Elevation Inventory. If you have elevation data, they would like you to give them information so that your data is discoverable by others. Your data need not be in the public domain, and the entry will provide a link to inquire about the data, or to a download site if available. This is not a repository for data; it is a way to make data findable.
Click here for more information and links on the CGIA website.
Wildfires can be sparked by a number of sources, including naturally via lightning strikes or simply by heat from the sun, but experts say most are caused by humans.
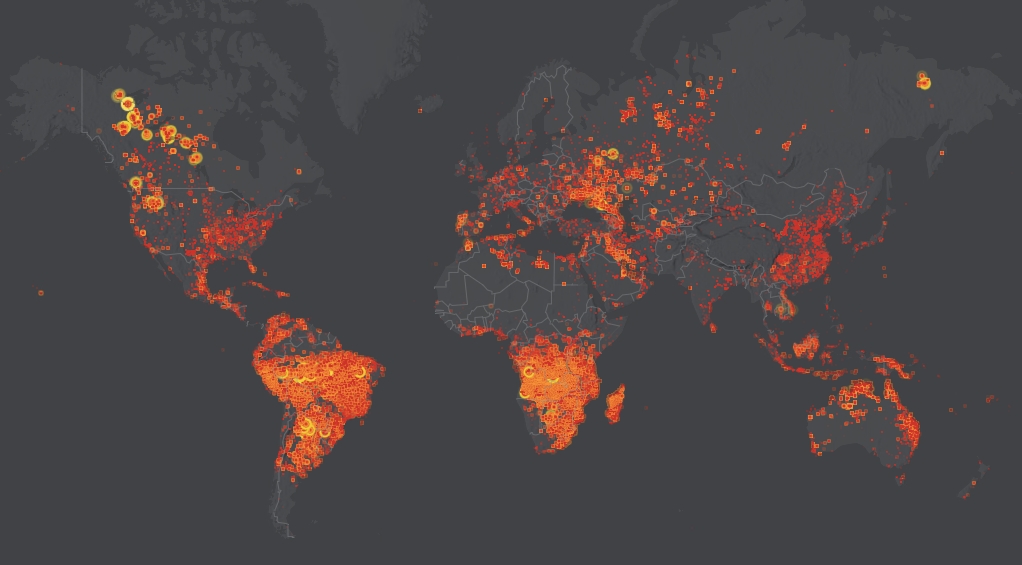
Many Earth-observing satellites can detect the heat signatures associated with wildfires. NOAA’s N-20 satellite passes over every spot on Earth at least twice a day and can detect fires with 375-meter accuracy.
Check out this wildfire app that displays hotspots and fire activity in real time in the US and Canada, and within 3 hours for the rest of the planet.
ArcGIS Enterprise 11.0 is here. Before you jump on the bandwagon, be aware that ArcGIS Enterprise 11.0 includes several retired and modified workflows. These architecture and application changes are likely to impact your environment when upgrading from an earlier version of the software. For example, the removal of the ArcMap-based runtime will prevent you from publishing map services using ArcMap. You will also need to convert ArcMap based services to ArcGIS Pro based services. You should consider 10.9.1 until you are ready for 11.