A common, frequent complaint about Los Angeles is that it’s so big and so sprawly and it feels like it goes on forever. Is it really? Let’s get a better grasp of LA’s relative size, care of self-storage-focused site Spare Foot, which superimpose LA’s city limits over the borders of other major cities (and even a few landmarks). The pairings also show how LA compares to other metropolises in terms of land area, population, and density per square mile. Check it out.
Category Archives: Maps/Apps/Charts/Data
Google Maps Offline Navigation and Search
Google Maps is now available offline. That means on your Android you can select an area to download from your phone and use it to navigate offline in areas that you don’t get good coverage in. And better yet, Google Maps can switch seamlessly between offline and online. Click here to read more.

GIS Day 2015
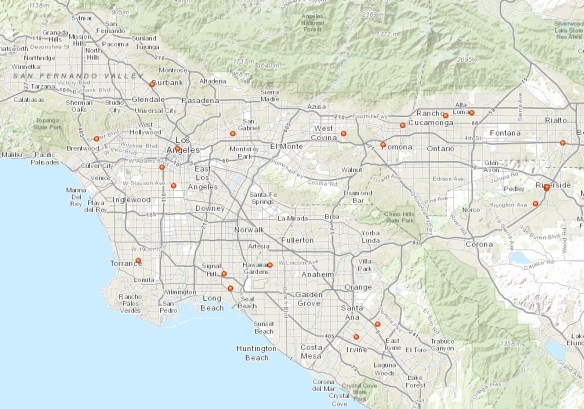
GIS Day is Wednesday, November 18th. If you are looking for a site to visit, check out this interactive map for the SoCalGIS area (and beyond).
Location data from gisday.com.
Land Records Information
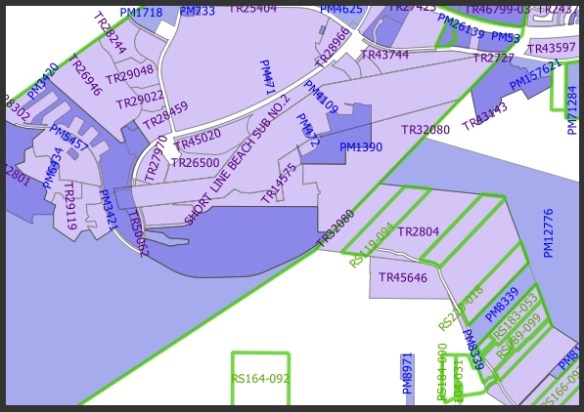
Need access to Tract and Parcel maps for a particular property? Maybe you want to incorporate Tract and Parcel map data in your applications? Take a look at the Land Records data provided by the Los Angeles County GIS Data Portal. The data has links to thousands of scanned documents online.
Here you can download shapefiles with links to Tract maps, Parcel maps, Records of Survey, Township plats and Landgrants, Subdivision activity, and City boundaries. Most of the data seems to be updated every quarter.
You can also take a look at their Land Records Viewer too.
Urban Legends Map
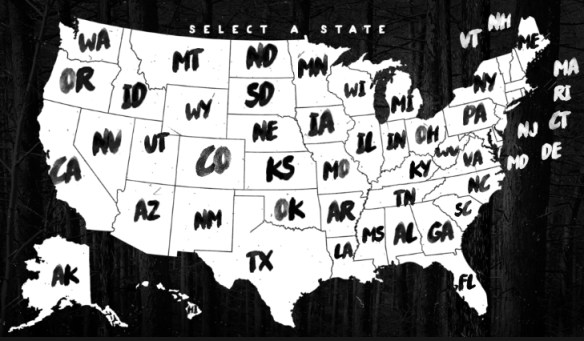
After you view the Halloween Candy Map, check out this one showing the craziest urban legends from each state!
Halloween Candy Map
The Great American Solar Eclipse 2017
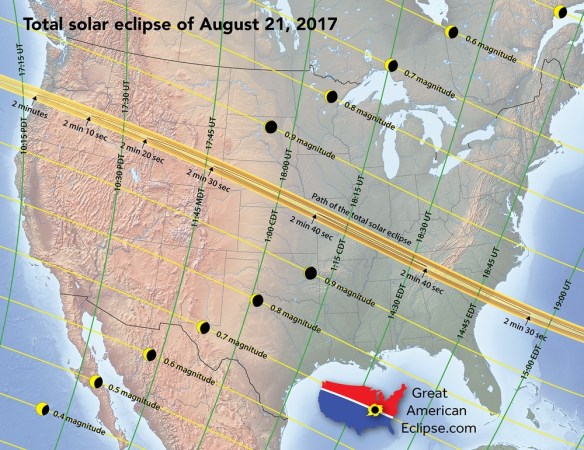
On August 21, 2017, the continental United States will experience a rare total solar eclipse that sweeps the nation from Oregon to South Carolina. Taking 94 minutes for the Moon’s shadow to race across the country, the duration of the total solar eclipse can last from 2 minutes near Depoe Bay, Oregon, to 2 minutes 41 seconds (the max) near Carbondale, Illinois, and 2 minutes 30 seconds near Awendaw, South Carolina. This will not happen again in the US until 2023 for an annular eclipse and 2024 for a total eclipse.
To help you plan your trip, take a look at these many maps including a 10 foot long strip map of the eclipse path. For more info, click below.
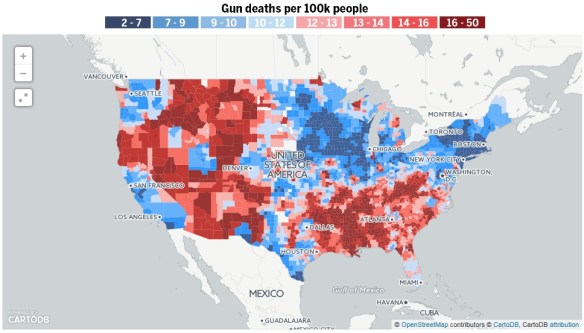
US Gun Deaths 2004-2010
Interesting interactive map showing gun deaths in the US. The map is based on data from the U.S. Centers for Disease Control and Prevention and shows the average number of gun deaths per 100,000 county residents from 2004 through 2010.
Note that the “gun deaths” map combines homicides, suicides, and accidents. There are also separate maps for suicides and homicides. Suicides really skew the statistics.
Thanks to Barry Waite of the City of Carson for finding this one.
5 New Ways to View Transit
If you work with transit data, you might want to take a look at the following blog post. Some great suggestions:
- Use services areas around transit stops instead of buffers around transit lines
- Incorporate frequency, like trips made per hour
- Consider travel time between places throughout the day
- Factor in transit frequency
- Incorporate demographic data to find what groups are underserved by transit or have a high level of need for better access to certain types of destinations
Check it out.
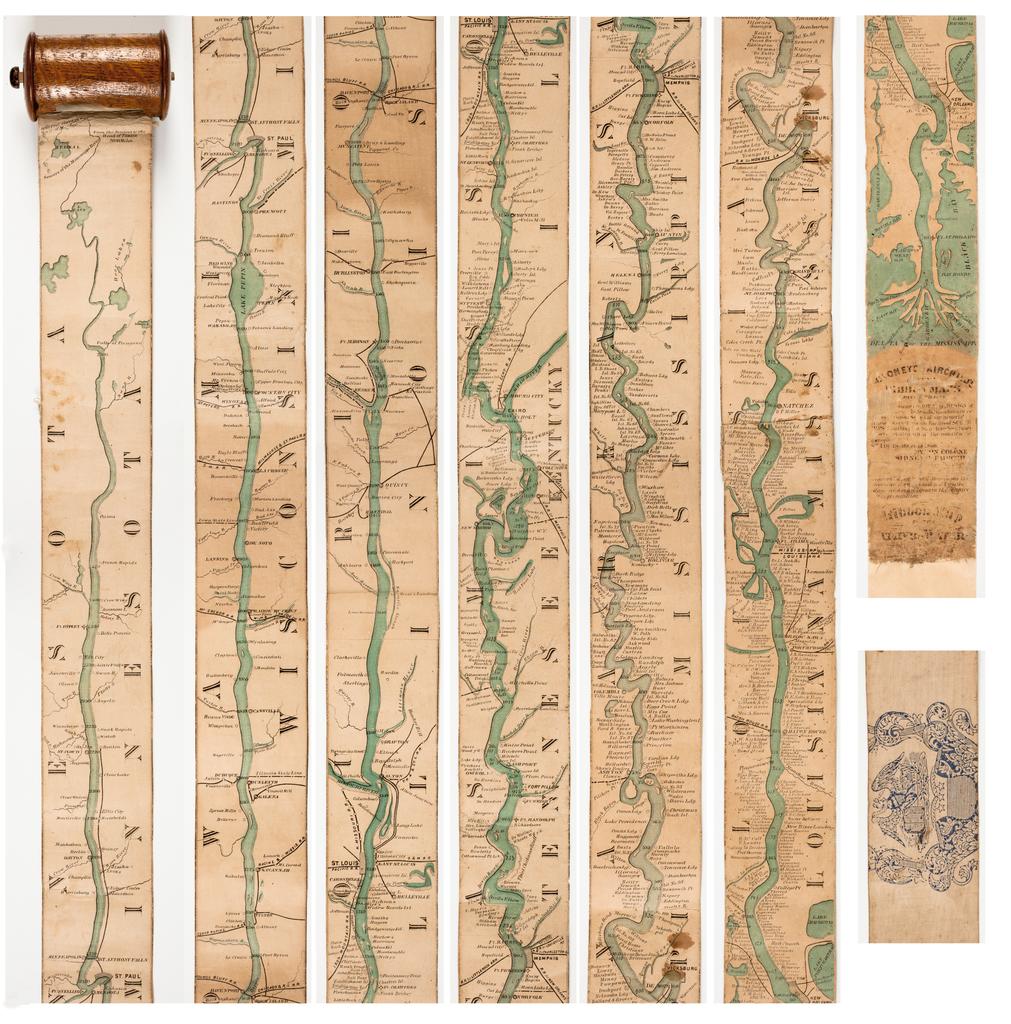
Strip Map of the Father of Waters
I have always liked strip maps. They go from one point to the other, maybe traversing a very long distance. The paper map can be very long and show a lot of stuff along the way. It’s like going on a trip without leaving your chair.
Here is an interesting 1866 strip map of the Mississippi River, allowing you to see the Father of Waters all at once. It was made for the steamboat traveler at the time and rolled up into a spool. Check it out and the history behind it.