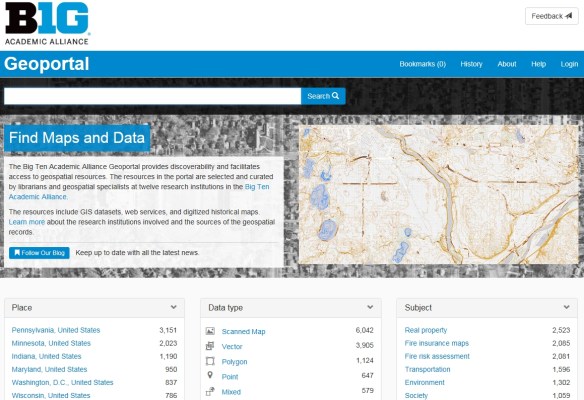
The Big Ten Academic Alliance Geoportal is a project that aims to make geospatial resources more discoverable and accessible to scholars. The Geoportal aggregates publicly-available geospatial resources, which are curated by librarians and specialists at twelve universities in the Big Ten Academic Alliance. These resources include GIS datasets, digitized historical maps, and web services, and each item is also accompanied by descriptive metadata along with links to download or view the full resource. They are easily searchable by both text and map and they can also be browsed by place, data type, and subject. The Geoportal’s resources include locations worldwide (including Antarctica), though their coverage is most extensive in the United States. It should be noted that this site does not itself host any data; instead, it serves as a one-stop shop that connects users to data hosted by numerous separate websites. Check it out!
Category Archives: Maps/Apps/Charts/Data
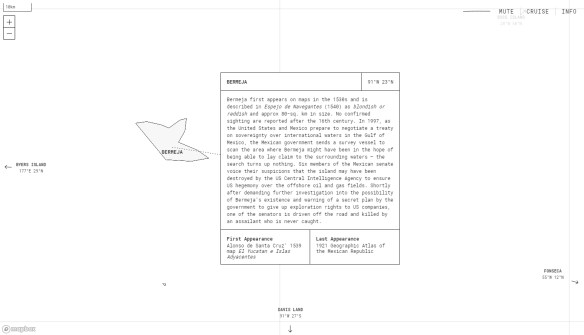
Phantom Islands – A Sonic Atlas
The term “phantom island” refers to an island that appeared on historical maps (sometimes for many years) even though it doesn’t exist. Most phantom islands emerged from the era of European sea exploration and colonization. Phantom Islands – A Sonic Atlas is a project that pairs original sound recordings with 27 phantom islands. Each of these islands are placed according to their coordinates on historical maps. Visitors can explore these individual islands by either taking a “cruise” or by navigating with their cursor. As one visits each island, they will hear a unique soundscape and can read about the island’s history, including the date of the island’s first and last appearance in print. Check it out!
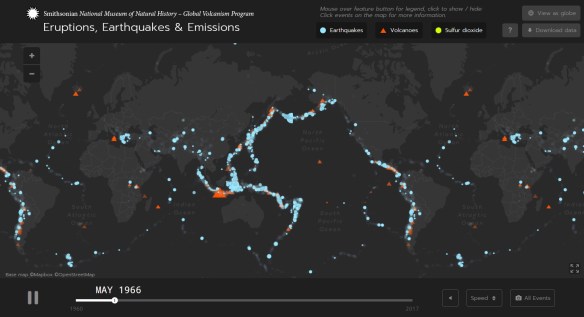
Eruptions, Earthquakes, and Emissions
The Smithsonian National Museum of Natural History has an interactive map for you to view a time-lapse animation of volcanic eruptions and earthquakes since 1960, and sulfer dioxide emissions from vulcanic eruptions since 1978. As you watch the animation, you can click on the symbols to view more information about specific earthquakes or volcanic explosions. If you are interested in further exploring this data you can download the datasets in a CSV or GeoJSON file. Check it out!
Fireworks 2018!
July 4th is almost here, and that means fireworks again! The fireworks app that has been used in the past few years has been updated, adding cities in San Bernardino County. Continue reading
World Cup Story Map
ESRI and DigitalGlobe have created a story map that visualizes the 12 stadiums being used for FIFA World Cup 2018 in Russia. The World Cup is a major sports draw every 4 years, with over 3.2 billion people watching. Even more remarkable is that this is the first time the event has taken place in Russia. Check it out!
Why Aerial Imagery Resolution Matters
Just found this interesting article about why you want the highest resolution imagery possible for your projects. Check it out.
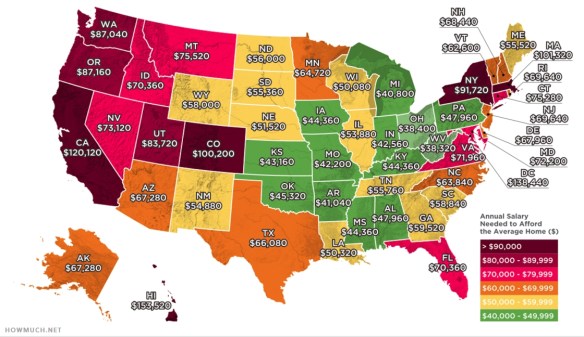
Salary Needed to Buy a Home
Bee Migration Mapping
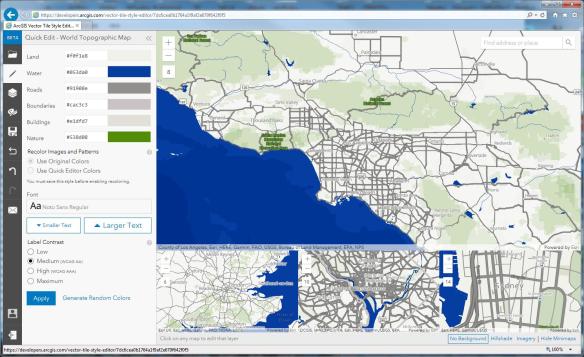
ArcGIS Vector Tile Style Editor
ESRI has announced the release of the ArcGIS Vector Tile Style Editor, available in beta on the ArcGIS for Developers website. The tool gives you a fast and easy way to create a custom basemap style.
By selecting an existing vector basemap, you can customize the layer colors and labels. You can edit everything from fill and text symbols to fonts, halos, patterns, transparency, and zoom level visibility. When you are finished, the styles are saved as an item in ArcGIS Online with a unique ID. The map viewer or any custom application can then reference the ID to display the basemap. Check it out.