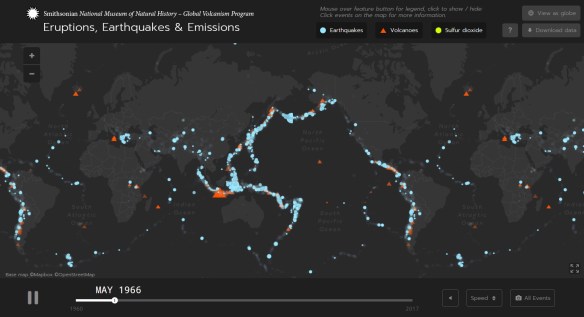
The Smithsonian National Museum of Natural History has an interactive map for you to view a time-lapse animation of volcanic eruptions and earthquakes since 1960, and sulfer dioxide emissions from vulcanic eruptions since 1978. As you watch the animation, you can click on the symbols to view more information about specific earthquakes or volcanic explosions. If you are interested in further exploring this data you can download the datasets in a CSV or GeoJSON file. Check it out!