The First Weather Map

Sir Francis Galton was the first to identify the anticyclone (as opposed to the cyclone), and introduced the use of charts showing areas of similar air pressure – the modern weather map.  His book Meteorographica was the first systematic attempt to gather, chart and interpret weather data on a continental scale, a fundamental work of modern scientific meteorology.

Galton prepared the first weather map published in the British newspaper The Times (April 1 1875, showing the weather from the previous day, March 31), now a standard feature in newspapers worldwide.  Click below to read more about Sir Francis Galton.

times-1875-apr01-012-f-first-weather-map

Beyond The Sea Interactive Map

Standing out on the shoreline, have you ever wondered if you set sail straight ahead across the sea what other beach would you run into?  Check out the Beyond The Sea interactive map.  You can move your mouse along a shoreline or click on a country to visualize all the locations which lie directly across the sea.  Location names will be displayed once the track hits land.  Colors of the lines represent the different destination continents.  Try the Start Fireworks button too for an impressive display!

beyondthesea


World Atlas of Desertification

20 years have passed since the last atlas of desertification was published by the EU.  Within that short period, the environment has undergone enormous global changes due largely to human activities.  Fortunately, because of the massive increase and growth in the availability of global and regional datasets, and the tools necessary to analyze them, significant progress has been made in understanding human-environment interactions.  Continue reading →

WWII Office of Strategic Services Maps

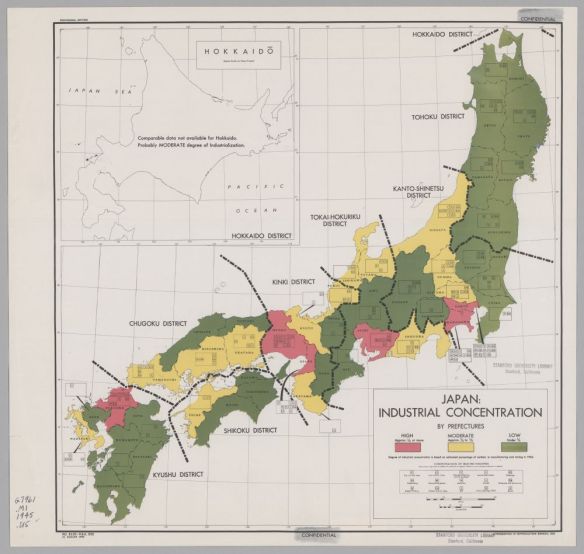
The Office of Strategic Services was formed in June 1942 in response to the entry of the United States into World War II. This was a time of codification of efforts around the collection of intelligence information in order to more effectively understand and respond to the events of the day. This effort brought together a number of experts, many from academia including a large number of cartographers. These cartographers created maps on demand that either stood alone or were part of reports. The maps were eventually distributed through the Federal Depository Library Program to libraries throughout the United States. The best estimate is that 5,753 unique maps were produced of which Stanford Libraries holds over 700.

Check out the new exhibit of maps by clicking below.

default

GIS Day 2018 is Here!

GIS Day 2018 is finally here.  I am sure most of us GIS types are going to show off our work this week.  Here are a few locations celebrating GIS Day this week:

Los Angeles County
City of Irvine
City of Riverside
UC Riverside
Ventura College
CSU Northridge
UCLA
Palomar College

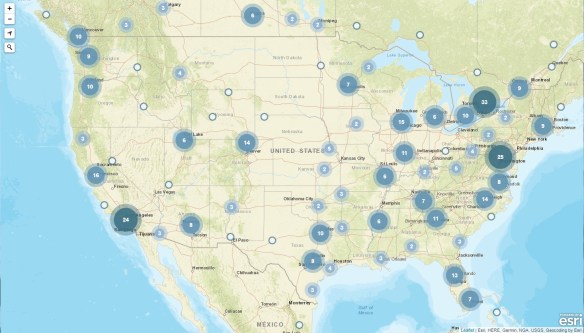
Also check out the GIS Day map for a location near you!

gisdaymap2018