How The Metric System Was Created

I remember trying to learn the metric system back in elementary school (1970’s).  Then it just went away like it was not important anymore.  I did not have to deal with it again until college.

How was the metric system created and adopted?  Well, France created the metric system!  The French Revolution (1789-99) and revolutionaries caused changes in many things, including the way things were measured in France.  The French public really did not like the new system and went back to the old ways, which exasperated Paris authorities, so the government sent police inspectors to marketplaces to enforce the new system.  In 1812, Napoleon abandoned the metric system though it was still taught in schools.  However, by 1840 it was reinstated.  Click below to read more about it!

p06lq045

The Early Days of GIS

If you are old enough, remember when you printed a map on a dot matrix printer?  How about those Calcomp plotters that used different colored ball point pen cartridges to make color maps?  Cross hatching was a big thing!

Check out this article about how advances in computer mapping shaped the early days of GIS.

dotmatrixmap

Every California Earthquake of the Last 30 Years

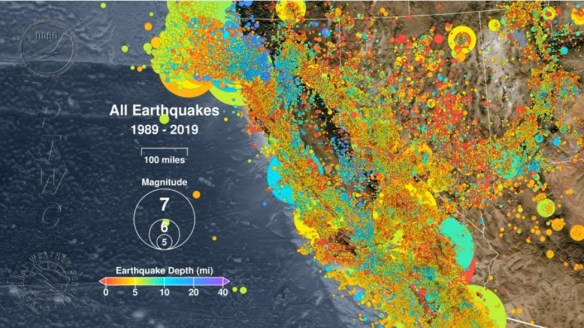
A new video from the Pacific Tsunami Warning Center maps every earthquake recorded in California in the last 30 years.  Check it out below.

The video starts in August 1989 and ends July 5, 2019 with the magnitude 7.1 quake in Ridgecrest.  The largest earthquake in the last 30 years was the magnitude 7.3 quake in the small Mojave Desert town of Landers in June 1992.

There is a composite image at the end of the video of all earthquakes, and really there are only a few areas in California that are earthquake free!

calearthquakes


2019 StoryMapper of the Year Contest

To give you the opportunity to demonstrate your skills using this next generation story builder, ESRI invites you to enter the 2019 StoryMapper of the Year Contest. The contest will also give you the chance to give back to your community at the same time!

The StoryMapper of the Year Contest started July 8, 2019, and the deadline for submission is 5:00 p.m. (PDT), September 30, 2019.  The contest submissions must be created using ArcGIS StoryMaps, not classic ESRI Story Maps apps.

The 2019 contest will work differently than contests in years past. To up the ante, ESRI added a monetary prize and community element.  When participants submit their entries, they will also describe how they would use a $5,000 donation from ESRI to make a positive impact on their communities through storytelling.

The winners will be announced by ESRI president Jack Dangermond on November 13, 2019, which is GIS Day.  Good Luck!

Fireworks 2019!

July 4th is just around the corner, which means there will be fireworks again!

Use the app to view cities in LA, Orange, Ventura, Riverside, and San Bernardino County that allow the sale and discharge of fireworks.  Included are days and times when fireworks will be sold and when you can light them up, as well as links to city websites and telephone numbers.  Data was collected from municipal codes, websites, and/or contacting each city.  Some cities allow sales to start today AND allow you to discharge them today as well!  Check it out!

fireworks2019

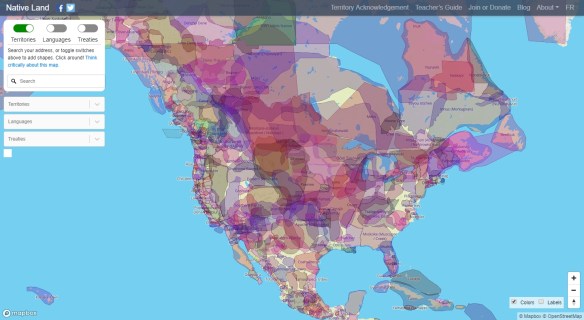
Native Land Interactive Map

If you are interested in the Indigenous histories of North America and beyond you may enjoy exploring Native Land, an ongoing interactive mapping project that attempts to outline ancestral Indigenous territories. Here, you will find a colorful map multi-layered with depictions of where different Indigenous peoples historically lived. You can browse the map itself or search for a particular postal code to see whose territories that location falls within, and clicking on a given territory shows the names of the native people(s) and cession treaties associated with that place with links to sources included. Check it out!