Found this posting on ranking the top 10 on-line GIS graduate programs:

Found this posting on ranking the top 10 on-line GIS graduate programs:
During the 2013 ESRI User Conference in San Diego, ESRI demonstrated what they called ArcGIS Professional. It was still under development at the time, but they said it was slated for a Q4 2013 release. That did not happen, though maybe it was for beta testing sites? Not sure.
Now they are saying it will be part of the ArcGIS 10.3 release planned for the second half of 2014. If you have not seen it yet, below is a video from the ESRI Federal GIS Conference in February 2014.

ArcGIS Pro has a ribbon interface that would be similar to Microsoft Excel and Word products. I personally don’t like that type of interface, the functionality gets lost to me. Others might find it natural though.
ArcGIS Pro is a 64-bit multi-threaded application that is designed to be the premier application for visualizing, editing, and performing analysis using your local content or content from your ArcGIS Online account or Portal for ArcGIS. You can author content in both 2D and 3D and publish it as feature, map, and analysis services, 3D web scenes, and web maps.
ESRI states that ArcGIS Pro will not replace ArcGIS for Desktop. Prediction: I give them 3 years before Desktop goes to live with ArcView 3.
The initial release will not have all the functionality that ArcGIS for Desktop has, but Pro will have capabilities that Desktop does not right now:
Map documents (.mxd), scenes (.sxd), and globes (.3dd) can be imported into ArcGIS Pro and saved as projects (.aprx). WHAT? Having ArcView 3 flashbacks?!!!
ESRI did state that projects are not backward compatible so you cannot go back to ArcMap. But keep in mind the geodatabases you use in Pro will also be accessible by ArcMap so there can be collaboration at the data level. Services published with Pro can be shared with ArcMap. Also, both can run side by side on the same machine.
ArcGIS Pro is part of ArcGIS for Desktop, so only ArcGIS for Desktop customers will be able to receive ArcGIS Pro. ArcGIS Pro will come in three licensing versions that correspond to Desktop license levels Basic, Standard, and Advanced. Also, the initial release of Pro will be able to work with the following Desktop extensions: 3D Analyst, Spatial Analyst, Network Analyst, Workflow Manager, and Data Reviewer.
ArcGIS Pro will run on Windows 7 or 8 on a 64-bit machine. 8GB of RAM or more is recommended.
There is no doubt that ArcGIS Pro will be featured at the ESRI Conference in San Diego this year! Looking forward to it. -mike
Looking to learn a little Python programming? Take a look at these free courses:
Learn to Program: Crafting Quality Code
An Introduction to Interactive Programming in Python
Using Python in ArcGIS Desktop 10
MIT: A Gental Intro to Programming Using Python
From Drew Decker at USGS:
I found this great video of time-lapse photography in and around Los Angeles at night.
Note that in most of the shots the camera is also moving while the time-lapse shots are taken, which makes for a great effect. It’s best to watch the full HD version here and read about the photographer and his projects. Here are the other two:
If you are interested, you are invited to the seventh webinar of the “Open Geospatial Science & Applications” webinar series on May 15th, 2014. The webinar will be open and free to all on first come register basis.
This webinar will be on MapStory, the Atlas of Change that everyone can edit. MapStory is a place to unify and improve our shared knowledge about global change. Mapstory envision a world where everyone’s wisdom can be tapped, peer reviewed and organised into a non-commercial global data commons that helps us all improve our understanding of global dynamics, worldwide, over the course of history. Details at http://mapstory.org .
This presentation will be by Dr. Christopher Tucker and is about the MapStory Foundation’s investment in the open source GeoNode, its use to enable crowdsourcing of open spatio-temporal data, and how people can use it to tell their stories to a global audience. He will be talking about the GeoGit/GeoNode integration that is happening this Summer and how that will open participation widely to users who have as little as a single edit to contribute.
Attendees will be able to interact with the speakers by sending their comments and questions through chat. All attendees of this web seminar will receive certificates for their participation. To register visit https://www2.gotomeeting.com/register/922723730 .
The recording will be made available also later for the benefit of the wider community at http://mundogeo.com/webinar/opengeoscienceandapplications/ .
Dear California GIS Community,
As many of you know, it has been a couple of years since the California GIS Council has met. During the recent California GIS Conference (CalGIS) in Monterey, three coordination meetings were held and many people expressed a strong desire to revitalize the GIS Council. During these discussions representatives from county, regional, state and federal level GIS organizations validated that it remains in California’s best interest to have the GIS Council to help move forward with the California spatial data infrastructure. In particular, the California Geographic Information Council (CGIA) expressed its commitment to support GIS Council activities.
Based on this input, eight of those in the earlier coordination meetings (including Carol Ostergren, Bruce Joffe, Robert Yohi, Mark Greninger, Christina Boggs, and me), scheduled a lunch meeting with GIO Scott Gregory at CalGIS. During that discussion Scott agreed that the GIS Council can play an important role in shaping California’s GIS data framework. He emphasized the importance of the Working Groups within the Council, and supports its new start. Scott also stressed the importance of deliverables related to Working Group activities. He would like to have each group develop, if they have not already, a business plan regarding mission, goals, objectives, and deliverables. Scottwill hold an advisory role on the Council, and will work closely with the Council and commit his or his staff’s time to participate in all GIS Council meetings and activities.
The GIS Council Meeting will be held on Thursday, May 22 in Sacramento from 9am – noon. The address is 1325 J Street, 16th Floor, and it will be held in the Zinfandel Conference Room.
There are several agenda items for this meeting, including:
More details will follow in subsequent email messages. The purpose of this message is for you to save-the-date on your calendar and consider stepping up to a leadership role on the Council. The Council has broad representation from multiple sectors, and there are many opportunities for participation!
If you would like further information or have any questions about the GIS Council and plans to move forward, please contact one of the following people:
In collaboration with the California Strategic Growth Council (SGC), I will be working with the GIS Council leadership to develop meeting agendas, communicate with the SGC and GIO about funding needs and opportunities, and facilitating the GIS Council meetings.
Please stay tuned for more messages about the GIS Council meeting on May 22nd.
Sincerely,
Karen Beardsley
Karen Beardsley, PhD, GISP
Managing Director, Information Center for the Environment (ICE)
Department of Environmental Science and Policy
One Shields Avenue
University of California
Davis, CA 95616
Ph: (530) 752-5678
Fax: (530) 752-3350
Cell: (530) 848-3310
kbeardsley@ucdavis.edu
The Program
During the cold war, there was a spy satellite program called Corona. The Corona program was a series of American strategic reconnaissance satellites produced and operated by the Central Intelligence Agency Directorate of Science & Technology with substantial assistance from the US Air Force. The Corona satellites were used for photographic surveillance of the Soviet Union (USSR), the People’s Republic of China, and other areas beginning in June 1959 and ending in May 1972. The name “Corona” was a code name, not an acronym.
The Technology Behind the Photos
During the program, there were 144 satellites launched, of which 102 returned usable photographs. The satellites orbited at altitudes of 100 miles above the Earth, with later missions orbiting even lower at 75 miles.

The satellites used special 70mm film with a 24 inch focal length camera manufactured by Eastman Kodak. The film was 0.0003 inches thick, with a resolution of 170 lines per 0.04 inches of film. The amount of film carried by the satellites varied from 8,000 feet for each camera to 16,000 feet. Most of the film shot was black and white.
So how did we get the film back? This is the cool part! The film was retrieved from orbit via a reentry capsule (nicknamed “film bucket“). Exposed film would be stored in the capsule, and when ready would then be ejected from the satellite to fall to earth. After the fierce heat of reentry was over, the heat shield surrounding the capsule was jettisoned at 60,000 feet and parachutes were deployed to slow the rate of descent. The capsule was then caught in mid-air by a passing airplane towing an airborne claw which would then winch it aboard!

The capsules were also designed for landing in the ocean. A salt plug in the base would dissolve after two days, allowing the capsule to sink if it was not picked up by the US Navy. On occasion the capsules landed by accident on land, which prompted the removal of the word “Secret” stamped on the capsule and replaced with words in eight languages offering a reward for their return to the United States. Hmm … I wonder if that worked? The film was processed at Eastman Kodak’s Hawkeye facility in Rochester, New York.
Here is a video about the Corona program. And here is an old calibration target used by the Corona satellites near Casa Grande, Arizona.
The Images
In 1995, President Clinton declassified 800,000 photographs from the Corona project in order to make them available for environmental and historical research. Archaeologists working in the Near East have been quick to embrace this newly available resource, which capture images of sites and landscapes in the 1960’s. Research into ancient landscapes at Harvard has used these images to investigate the communication networks of the Early Bronze Age, state-sponsored irrigation under the Assyrian and Sasanian empires, and pastoral nomadic landscapes in northwestern Iran and southeastern Turkey.
For archaeology, Corona photographs have two tremendous advantages over other space-based imagery sources. Many rural parts of the Near East have escaped agricultural development and urban growth until recent decades, when many have been damaged or destroyed. Corona photographs predate this destructive development and thus preserve a record of landscapes that are difficult or impossible to map on the ground. Corona images were made before cities such as Mosul in Iraq and Amman in Jordan overran the many archaeological sites near them. Dams have also flooded river valleys, covering many other archaeological sites. As cities grew, the industrial farming and irrigation that supported them grew too, obscuring roads and sites clearly visible in the Corona images. More recent commercial sensors such as Ikonos and QuickBird have a higher resolution, but they capture the modern damaged landscape of today.
Corona photographs are also of high resolution, capable of displaying features as small as 2 meters in ideal conditions. Many features visible in Corona cannot be seen in medium resolution satellites such as Landsat (30 m) or ASTER (15 m).
Recently, a team from Arkansas’s Center for Advanced Spatial Technologies have built a free, public tool to explore the Corona images of the Middle East.

The team plans on adding more images from Corona, such as areas of Russia and China.
Strava, which provides an app for you to track your rides and runs via your iPhone, Android or dedicated GPS device, has released an interactive global heat map showing logs of 77,688,848 rides and 19,660,163 runs. The heat map draws from about 220 billion data points and provides a detailed picture of where people bike and run. Below is the LA area, but you can zoom out to view the world.

Popular routes are in red, moderate in dark blue, and less traveled in light blue. You can view biking or running separately or together, change the path opacity, and also change the heat map style.
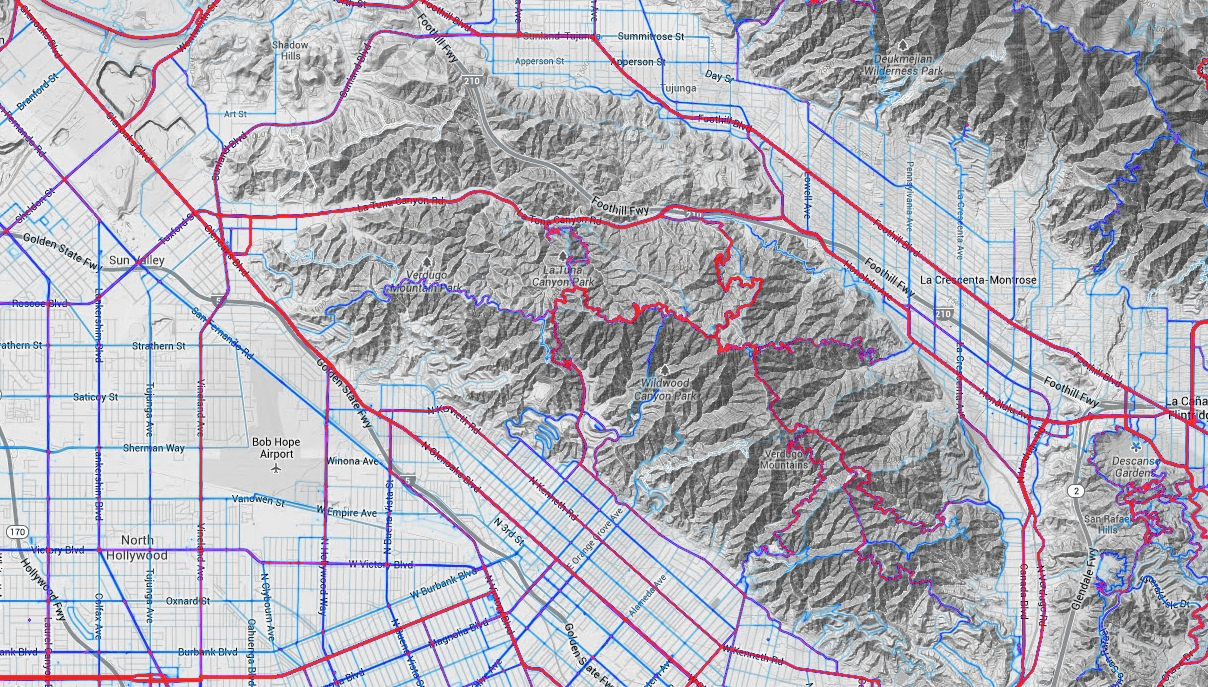
If you are a planner looking to establish new bike paths and trails, this information could be gold for you!
There is a free self-paced introductory GIS course available from Simon Fraser University. Participants will learn about GIS and how the technology is being used in the real world to support problem-solving and decision-making. Participants will create and manage spatial databases, produce well-designed maps, and undertake spatial data analysis using free online software tools.