
Strava, which provides an app for you to track your rides and runs via your iPhone, Android or dedicated GPS device, has released an interactive global heat map showing logs of 77,688,848 rides and 19,660,163 runs. The heat map draws from about 220 billion data points and provides a detailed picture of where people bike and run. Below is the LA area, but you can zoom out to view the world.

Popular routes are in red, moderate in dark blue, and less traveled in light blue. You can view biking or running separately or together, change the path opacity, and also change the heat map style.
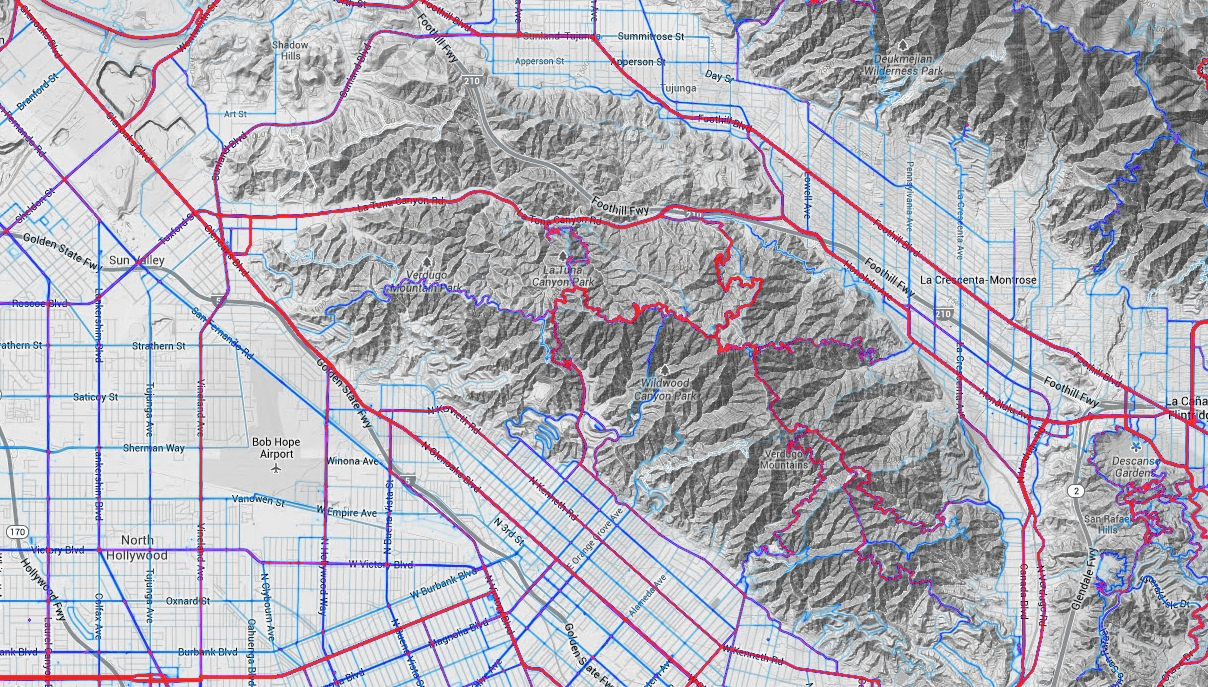
If you are a planner looking to establish new bike paths and trails, this information could be gold for you!

Pingback: Los Angeles County Enterprise GIS – GIS APPLICATIONS | All Around GIS