Say Bye Bye to US Survey Foot

I remember 30 years ago working on ESRI’s COGO software. If you ever used it back in the day, you were a hero creating a landbase from scratch with only measurements from tract and parcel maps and making sure everything closed well with your traverses.

One thing I found interesting was there were two definitions for measuring 1 foot. There was the international foot, which was defined as 1 inch = 2.54 centimeters exactly, or 1 foot = 0.3048 meters exactly. The other was the older US survey foot, which was defined as 39.37 inches = 1 meter exactly, or 1 foot = approximately 0.304800609601 meters, or multiplying US survey feet by the fraction 1200/3937 to get meters.

The US survey foot has been around since 1893 while the international foot was established in 1959 and is slightly more exact. One of the reasons we retained the US survey foot was because of our state plane coordinate systems, which were derived from the national geodetic control network, and are based on the relationship of 1 meter equaling 39.37 inches exactly. Fundamental survey units, such as rods, chains, statute miles, acres, sections, and townships, all depend on the relationship of 1 meter equaling 39.37 inches exactly.

Using two measurements for the same unit have been confusing over the years. But now the US survey foot will be obsolete by January 1, 2023. Click below to read more about it!

ussurveyfoot

Mobility Trends from Apple

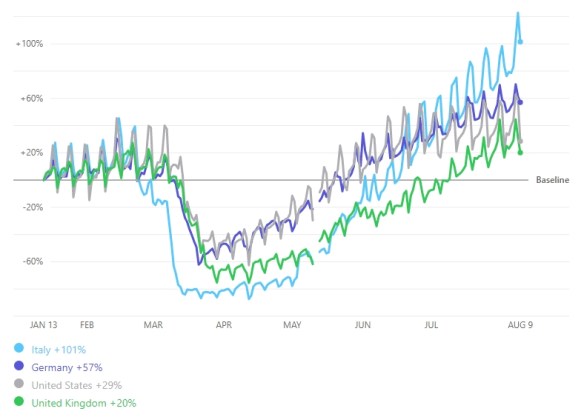
Besides Google’s Community Mobility Reports, Apple has their own data on COVID-19 Mobility Trends.  Their data was generated by counting the number of requests made to Apple Maps for directions in select countries/regions, sub-regions, and cities.  The thought is as COVID-19 lock downs go down, direction requests go up.  Check it out!

applemobility

Community Mobility Reports

Check out Google’s Community Mobility Reports that provide insights into how people’s movements in countries around the world were altered during the lock down period of COVID-19.  Also you can see mobility change since countries have eased movement restrictions.

The reports use aggregated anonymized data from mobile phones to chart trends in movement over time.  They show how visits to different venues (like retail, groceries, parks, transit stations, etc.) have been effected by government lock downs.  Check it out!

mobilityreports

An overview and how to understand the data can be found here.

2020 ESRI UC All Done

Well, the 2020 ESRI UC has come and gone … actually there are a few more online events and special interest group meetings today.  My impression of this online conference?  Let’s just say parts were informative.  However, I bet it was a monumental task to pull it all together.

The plenary and workshop videos are still online when you login to esri.com/uc .  Not sure how long they will stay up.  I did notice they have some recorded content on YouTube here and also on the ESRI video site here.

Add a comment below about your impressions of the conference.  Let’s hope we are back in San Diego next year!

SCAG/ESRI Special Interest Group Meeting Today

Hello everyone,

This is a reminder of the SCAG/ESRI Special Interest Group meeting, Thursday July 16th from 1 pm to 3 pm.  It is a free event and open to all government agencies.  It will introduce you to an exciting new initiative: the SCAG Regional Data Platform (RDP).  Your involvement in this project is essential to shaping the future of planning and sustainable development in the SCAG region, locally and regionally. To kick-start a meaningful collaboration, we would like to gather local jurisdictions to introduce the project and what it means to you, showcase initial ideas, ask for feedback, and explain what’s coming in the next year. This meeting will also highlight progress on a number of other SCAG initiatives, such as the SoCal Greenprint, and High Injury Network (HIN).

*Please note that this Special Interest Group Meeting is a private event, and is therefore not listed in the official EsriUser Conference schedule

We hope you will join us for this special event!

Join us via Zoom
https://esri.zoom.us/j/98165518627

Please RSVP to the SCAG Special Interest Group Meeting

https://arcg.is/1iGvKK

The RDP Core Team, Tom Vo at vo@scag.ca.gov or Javier Aguilar at aguilar@scag.ca.gov can answers any questions and provide further information on this event.

Best Regards,

SCAG RDP Core Team

Virtual URISA GIS Leadership Academy

URISA just announced their Inaugural Virtual GIS Leadership Academy, to be held August 3-7, limited to 30 individuals.

The curriculum emphasizes best practices and skills-based training taught by GIS experts committed to preparing others for leadership in managing challenges and figuring ways to help groups and organizations achieve their goals.  The cost to attend will be $600 for URISA members and $800 for non-members.

For more info and to register, click here.

US Flood Risk Map

A new online flood risk map has been released by the nonprofit organization First Street Foundation.  The online tool can tell you the current flood risk for your home and possible future risks.

The flood model used by Flood Factor is based on models of flood risk from rainfall, overflowing rivers high tides, and coastal storm surge.  It takes into account such as factors as flooding history, elevation and proximity to water.  To predict future risk of flooding other factors are also taken into account, such as different climate models and predicted sea level rise and predicted future precipitation patterns in the local area.  Check it out!

floodrisk