Los Angeles County GIS has made the Woolsey Fire perimeter data available for download. Visit the page here for more info.
Woolsey Fire Data
Reply

Los Angeles County GIS has made the Woolsey Fire perimeter data available for download. Visit the page here for more info.
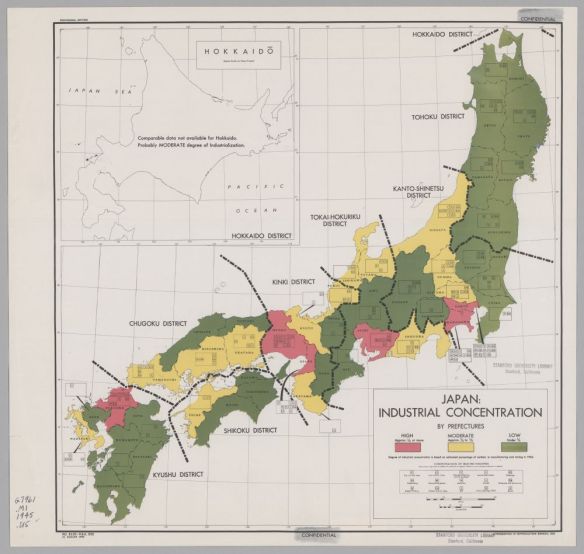
The Office of Strategic Services was formed in June 1942 in response to the entry of the United States into World War II. This was a time of codification of efforts around the collection of intelligence information in order to more effectively understand and respond to the events of the day. This effort brought together a number of experts, many from academia including a large number of cartographers. These cartographers created maps on demand that either stood alone or were part of reports. The maps were eventually distributed through the Federal Depository Library Program to libraries throughout the United States. The best estimate is that 5,753 unique maps were produced of which Stanford Libraries holds over 700.
Check out the new exhibit of maps by clicking below.
GIS Day 2018 is finally here. I am sure most of us GIS types are going to show off our work this week. Here are a few locations celebrating GIS Day this week:
Los Angeles County
City of Irvine
City of Riverside
UC Riverside
Ventura College
CSU Northridge
UCLA
Palomar College
Also check out the GIS Day map for a location near you!
Check out this interactive map by The San Francisco Chronicle which provides information on wildfires burning across California. The map displays the ongoing/contained fire origins, current/previous fire perimeters, current hot spots, and current air quality.
![]()
Check out this satellite image of the fires in California and the smoke that has blown out to sea. It was taken at noon today.

You can view full disk images of the Earth and different sensor images and loops at the GOES East Image Viewer.
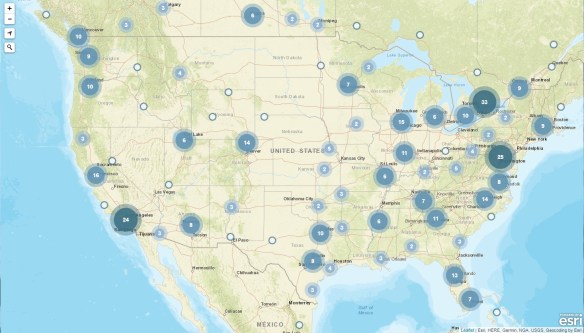
Over the past several years student loan debt has emerged as an issue for many. Approximately 44 million Americans collectively owe a staggering total of more than $1.4 trillion in student debt.
Mapping Student Debt is a project that explores the geography of this debt burden and shows how borrowing for college affects the nation, your city, and even your neighborhood. There are 3 zoomable maps, each with several layer options. Check them out!

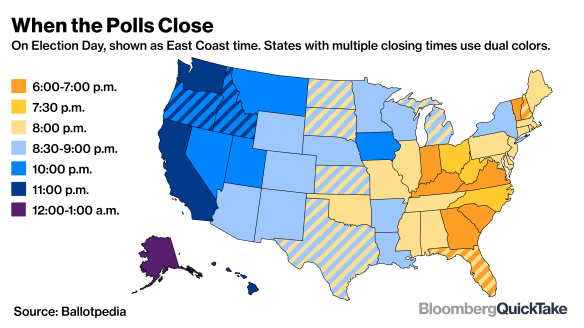
Wondering what time your local polling place closes today? Check out the map below. Note times are shown as East Coast time.
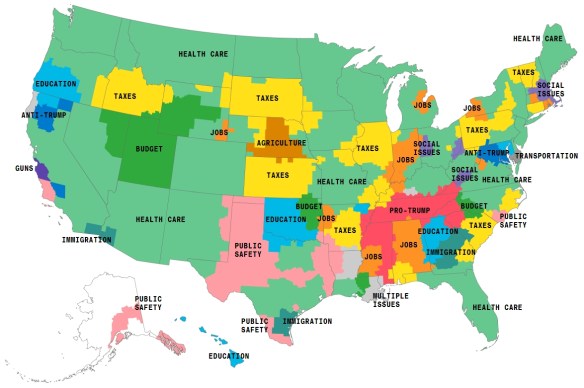
Check out this article about the election ad themes being seen on TV throughout the country.
Don’t forget to vote!
Americans are expected to spend about $9 billion on Halloween this year as they buy costumes, decorations, greeting cards and candy for the annual Oct. 31 event.
The National Retail Federation estimates that more than 175 million Americans are planning to participate in Halloween activities this year, spending about $3.2 billion on costumes, $2.7 billion on decorations, and $2.6 billion on candy.
Bulk candy dealer CandyStore.com looked through 11 years of data to come up with the favorite Halloween candy in each U.S. state. Continue reading
Ah taxes, don’t you just love em? Every year there seems to be a new tax we have to pay. And now there is Measure W for a new proposed property tax, and it uses GIS! Et tu, GIS? 🙂
Do you own property in LA County? Read on. You rent in LA County? Your landlord can raise your rent to cover the tax. You should read on too. Continue reading
