
Ah taxes, don’t you just love em? Every year there seems to be a new tax we have to pay. And now there is Measure W for a new proposed property tax, and it uses GIS! Et tu, GIS? 🙂
Do you own property in LA County? Read on. You rent in LA County? Your landlord can raise your rent to cover the tax. You should read on too.
Measure W is a LA County measure that is on the ballot in November. Titled as “Los Angeles Region’s Public Health and Safe, Clean Water Program“, if passed the LA County Flood Control District would levy a tax annually on parcels at a rate of 2.5 cents per square foot of impermeable area. Proceeds from the tax will be used to fund projects and programs such as increasing storm water capture and reducing urban runoff pollution. The tax would not end.
The measure defines what is considered impermeable and permeable areas on your property:
“Impermeable area means a parcel area covered by materials or constructed surfaces such as buildings, roofs, paved roadways, sidewalks, driveways, parking lots, brick, asphalt, concrete, pavers, covers, slabs, sheds, pools, and other constructed surfaces or hardscape features. Impermeable areas do not include permeable surfaces such as vegetated areas, grasses, bushes, shrubs, lawns, bare soil, tree canopy, natural water bodies, wetland areas, gravel, gardens and planters on bare soil, rocky shores, and other natural areas.”
So the idea is to tax impermeable areas on your property, which basically are areas that do not allow water to filter back into the ground.
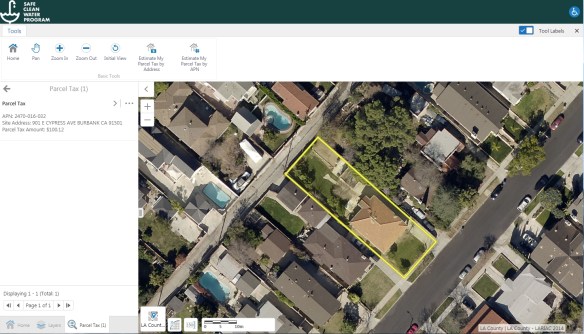
You may be asking how much are your taxes going to go up if Measure W passes? Well there is a GIS app for that! Just click below to visit the County’s Parcel Tax Calculator. Enter an address or parcel number to see the proposed tax. You can also turn on the 2014 aerial for a backdrop.
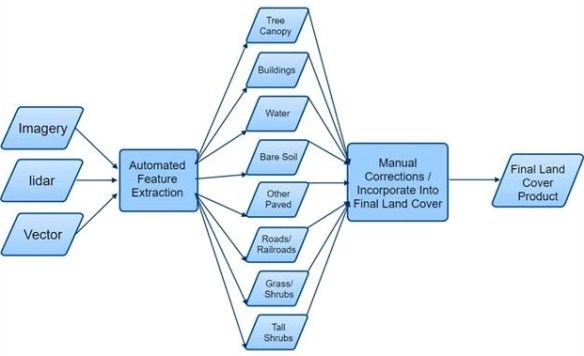
So what is the County using to make the impermeable area calculations? If you are a LARIAC member, you actually have that GIS data … if you downloaded it a while back. It is the 2016 Land Cover data which came from LARIAC4. Eight land cover classes were created using an object-oriented image analysis software called eCognition. Data used to create the land cover data included 2014 LARIAC & NAIP imagery, 2016 LiDAR, CAMS data, 2014 building outlines, and land type data. The software was first trained to recognize the different land cover classes and then automated the feature extraction process.
The resulting data was a gigantic GeoTIFF file (242 GB) with eight pixel colors that represents the different land cover classes. The GeoTIFF covers the entire County.
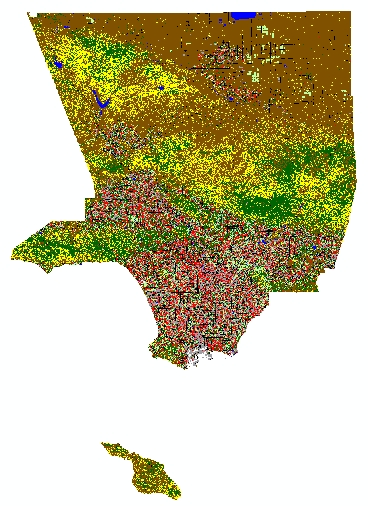
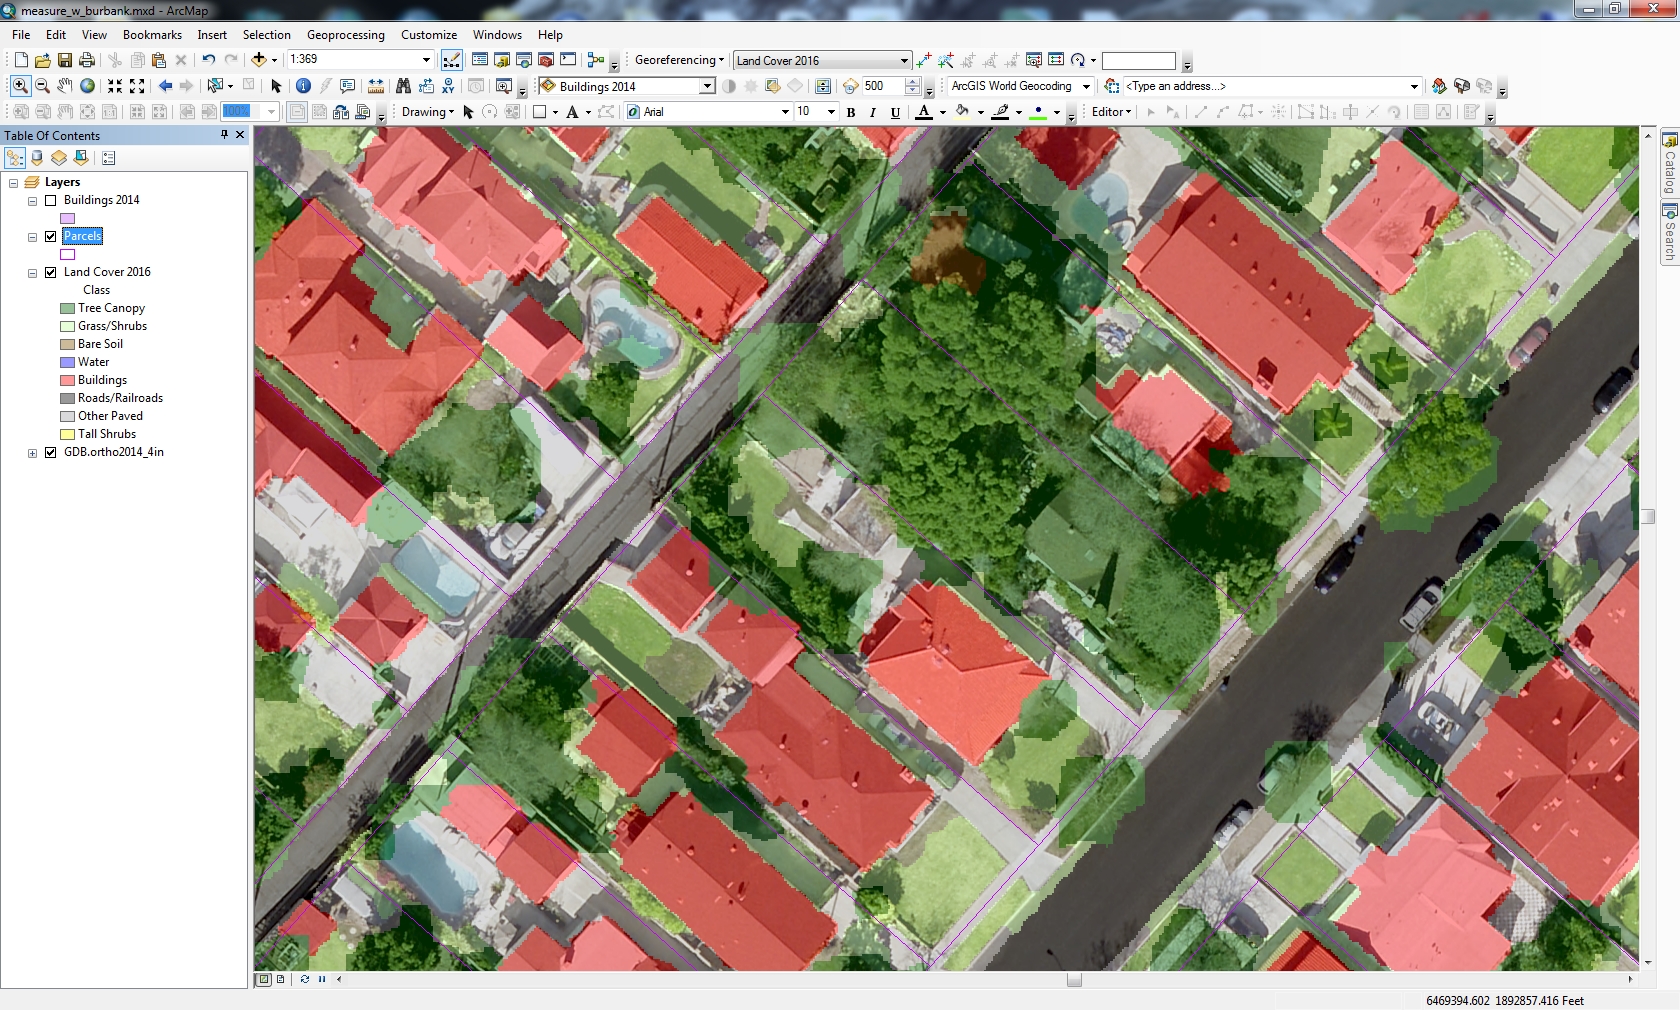
Amazingly, the GeoTIFF is at 9 inch resolution for the land cover classes. Here is an area in Burbank.
The accuracy of the land cover classifications are also really good. According to the accuracy assessment document that came with the data:
Two independent accuracy assessments were performed on the land cover data. The first compared the mapped land cover data to 1:100 scale planimetric data. The second compared the mapped land cover data to reference photo interpretations of over 1000 random points.
The results of the area assessment indicated that the area weighted average of all errors equaled 2.14% for an overall area based accuracy of 97.86%. No individual land cover class was less than 93% accurate by area, with grass and soil being the lowest. All other classes were greater than 97% accurate by area. Combined impervious surfaces were greater than 98% accurate by area.
The results of the random point assessment indicated an overall classification accuracy of 95%. By combining the Grass, Scrub Shrub, and Bare Soil classes the resulting accuracy improves to over 97%.
So I guess when the County calculates your parcel’s tax on impermeable area, it should be really close to what it actually is … or is it? You can do a quick visual check by overlaying the land cover with the 2014 aerial photography. Remember, you must use LARIAC 2014, not our current 2017, because that is what was used to create the land cover data. Making the land cover transparent helps visualize the data on top of the aerial photography:
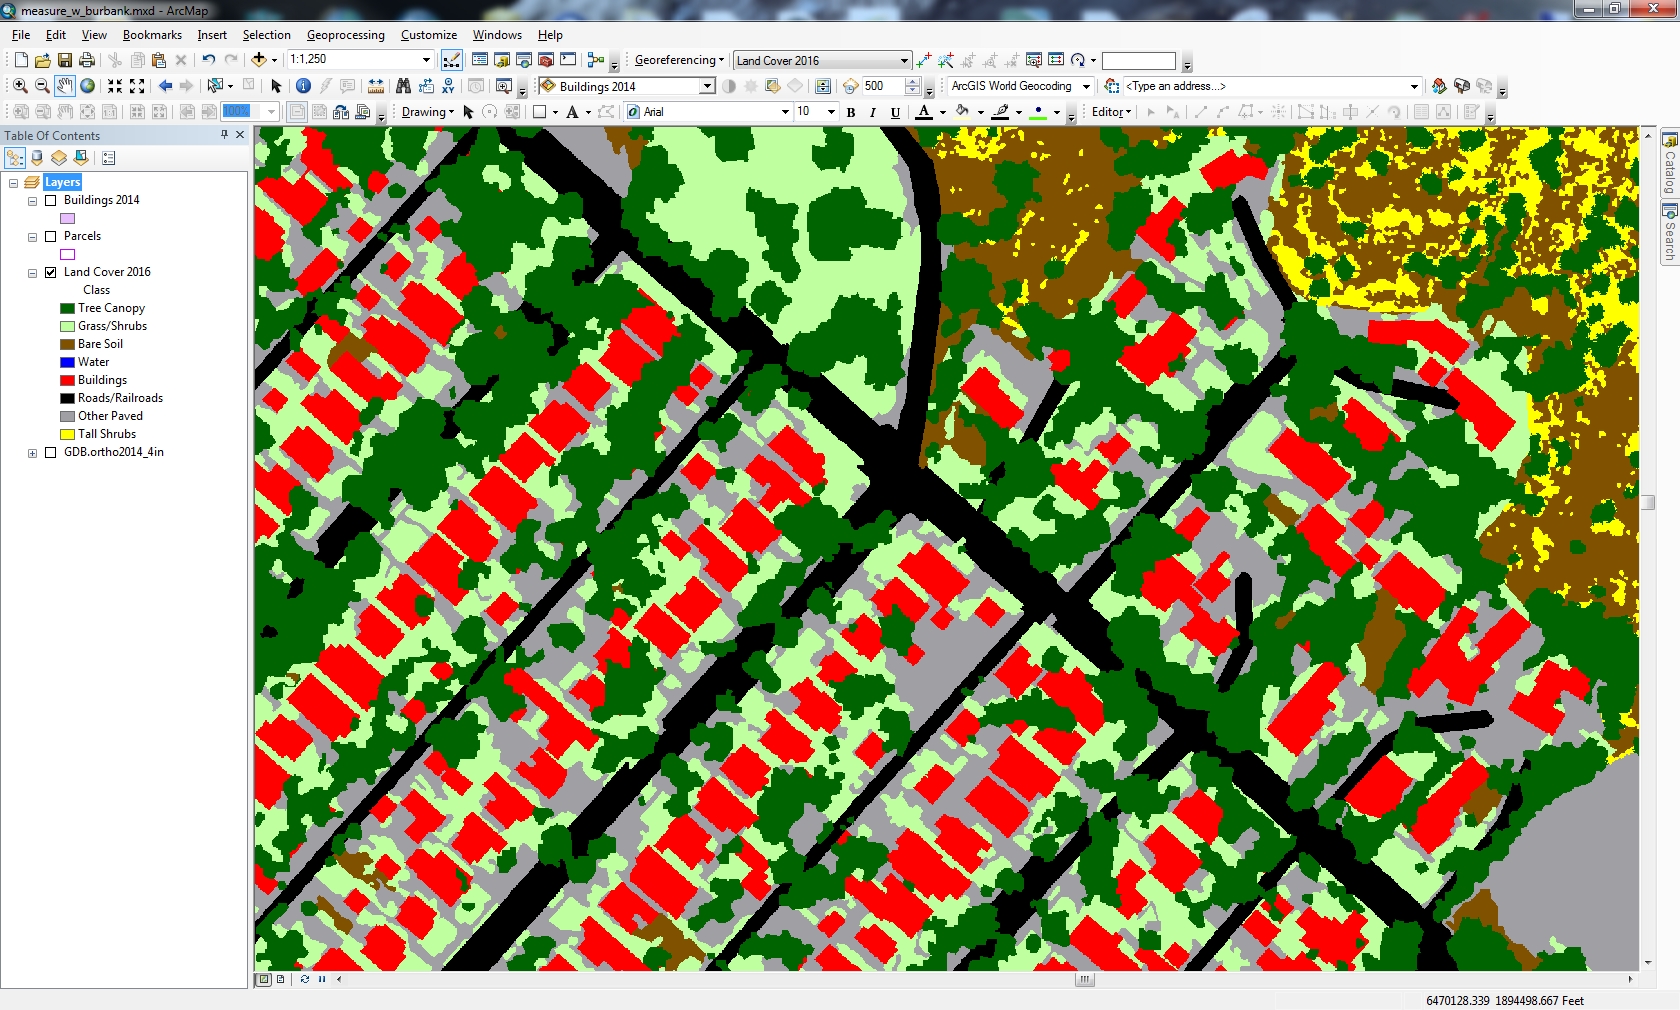
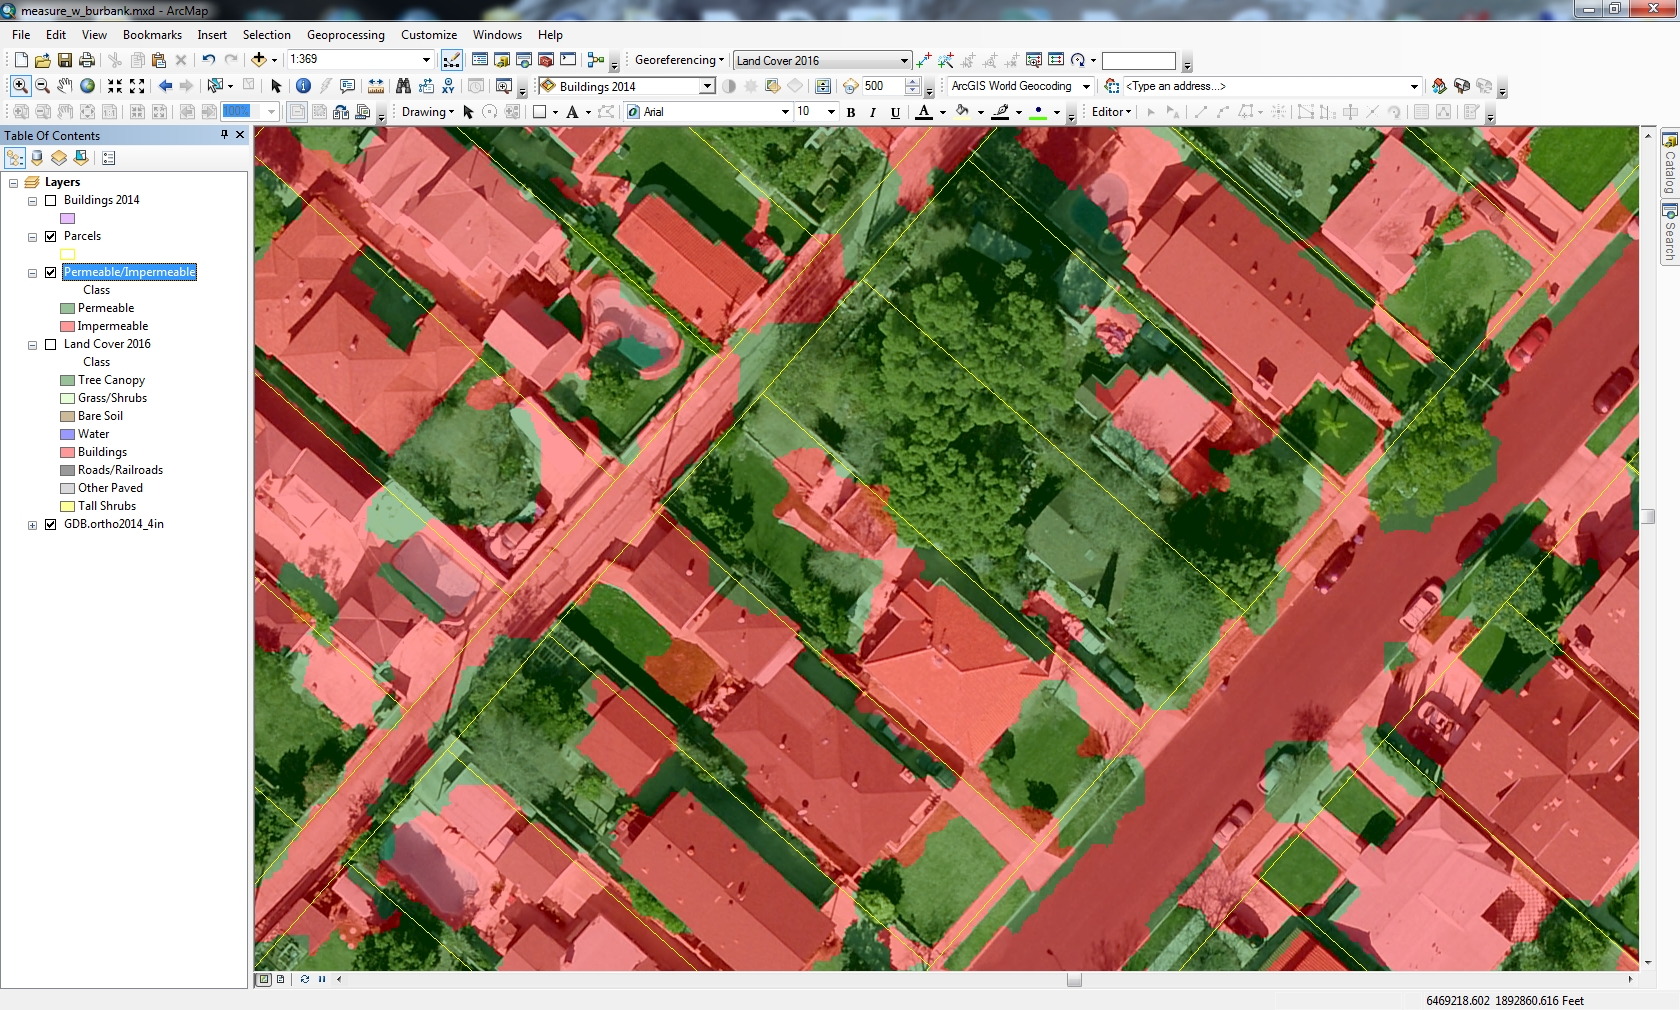
You could even reclassify the land cover data into permeable/impermeable areas. A quick way is just to change the symbology and group the 8 categories into two categories and lump Tree Canopy (1), Grass/Shrubs (2), Bare Soil (3), Water (4), and Tall Shrubs (8) into “Permeable” and Buildings (5), Roads/Railroads (6), and Other Paved (7) into “Impermeable”. I copied the Land Cover 2016 layer, then reclassed the categories and used green for permeable and red for impermeable:

So visually you can see what area in each parcel would be taxed at 2.5 cents per square foot, which are the red areas.
I wish the County did this in their app. It would help property owners see what areas of their parcel are being taxed.
At this point you are probably seeing some issues with the data, like areas of grass being classified as impermeable. In that case the owner will be paying more per year in the tax. Also note one of the parcels is almost totally classified as permeable, yet you can see a house amongst the trees and a driveway with cars. In that case the owner will get a big break in the tax. Checking the app, the owner will pay a tax of $9.02 per year, but should really be paying more. I guess the errors seen in this small sample area are part of the 2% in the accuracy assessment?
Which brings up a bigger question about the data used here. For example, 2014 aerial photography and building outlines were used. It’s 2018 now, and if Measure W passes, it starts in fiscal year 2019-20. A lot can change, buildings built/demolished, trees removed/planted, pavement to grass/grass to pavement, etc. I’m sure they will update the data from time to time which will change the tax per parcel.
Then there are other issues like someone that uses porous pavement or permeable pavers that allows the water to go through. They will be taxed on that, but shouldn’t. Also some would argue about pools, they retain the water and if you’re trying to minimize storm water runoff, pools will not contribute excess runoff under reasonable conditions. However, by the impermeable definition a pool does not allow the water back into the ground, so they are considered an impermeable surface.
And what about a tree canopy that covers a building? The building is an impermeable surface, but because it is covered by trees it is not counted here. Interesting huh? Good for you if you have a lot of trees on your property, especially if they cover areas like pavement and buildings.

The devil is in the details with Measure W. The full text can be found in your sample ballot, or you can read it in all it’s glory here. A synopsis and arguments for and against can be found here. Also articles about it here and here.
And don’t forget, the tax will not expire, but I am sure it will go up over time like everything else! Ah taxes.
Don’t forget to vote in November! -mike

Good information here. I agree with most of your assessment. Remember, there is an appeal process, so that is one way a homeowner would be able to dispute their amount of permeability (or the tax). But here’s a link to Heal the Bay – on Measure W. That’s another thing I think people should look at: https://healthebay.org/measure-w-los-angeles/.
Thanks Nick! -mike
Interesting use of GIS data..
Thanks John!
Thanks for this! I have been looking around in vain for the “Land Cover Survey” mentioned in the measure. Is this data product available in the county’s egisgcx.isd.lacounty.gov GIS viewer? I found a few LARIAC4 layers, but none seemed to have the ones you are showing. Strange that the county can use this map to tax us, yet doesn’t make it available to the public?
Hi Jon. The land cover survey data was part of the LARIAC project and was provided to the government agencies that participated in LARIAC4. To my knowledge the County does not provide the data to the public or even display it in a way I did in this post. I’m sure if you pursue a public records request with the County, they would supply the data to you in it’s original format.