Unknown's avatar

About socalgovgis - Michael Carson

Michael Carson, GIS Manager (retired) for the City of Burbank and President of Southern California Government GIS User Group. Currently teaching GIS at College of the Canyons in Santa Clarita.

USGS Map Engravings Available for Transfer, Donation, or Sale

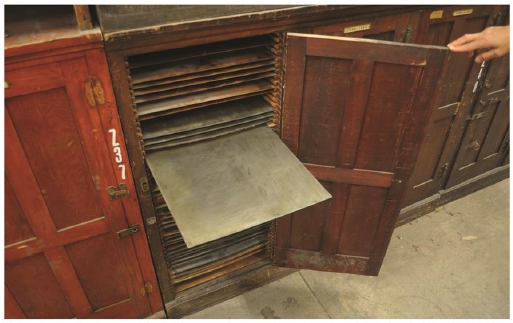
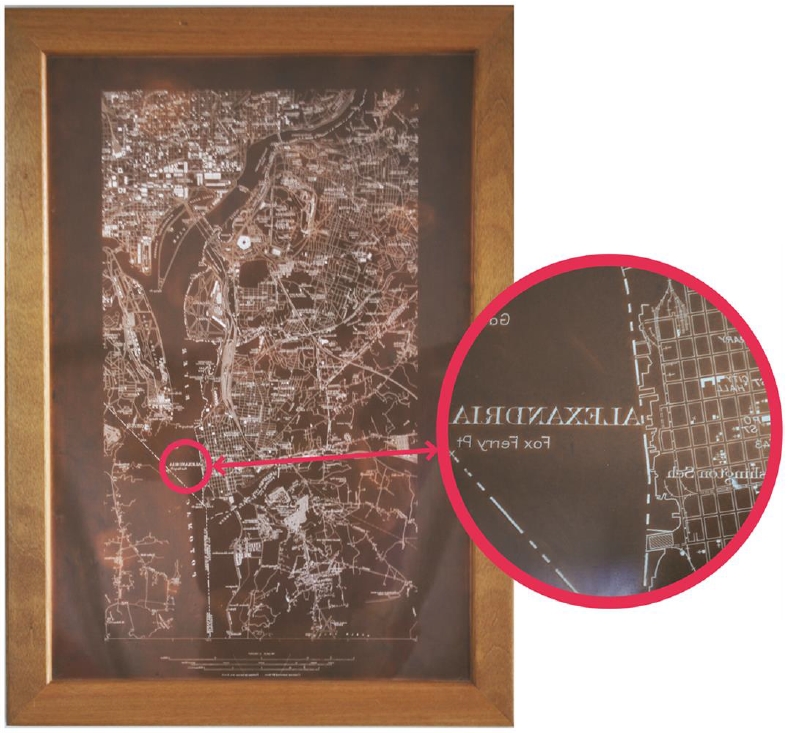
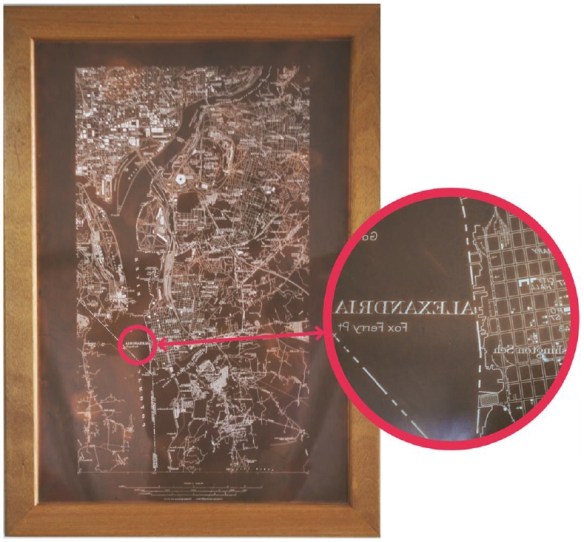
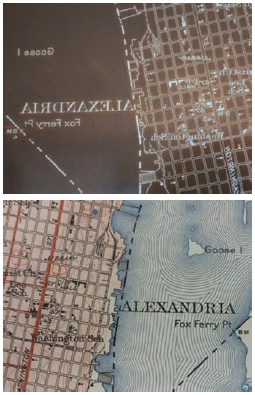
Beginning this summer the Federal Government will release excess engravings once used to reproduce U.S. Geological Survey (USGS) topographic and geologic maps and other scientific illustrations.
engravings2

engravings1

engravings3

The process makes these unique engravings, created from the 1880s to the 1950s, available for transfer to Federal agencies; for donation to State and local governments, certain non-profit educational and other organizations, and public agencies; and for sale to the public.

Those interested in obtaining engravings need to understand the phases of the process; know how to request the engravings; plan the logistics to receive, pack, load, and transport them; and be ready to request a donation or to make a purchase offer when the engravings become available.

More information about the engravings and the process for transfer, donation, or sales of the engravings is available through ftp://ftpext.usgs.gov/pub/er/va/reston/Engravings/.

State and local governments, certain non-profit educational and other organizations, and public agencies interested in receiving a donation should establish their eligibility now with their State Agency for Surplus Property (SASP). The SASPs are listed at http://www.gsa.gov/portal/content/100851.  Only the SASP can request a donation on your behalf.

The engravings will be available through a process managed by the U.S. General Services Administration (GSA).

USGS will post supporting status information weekly through ftp://ftpext.usgs.gov/pub/er/va/reston/Engravings/.


ArcMap: I Just Want the XY

How many times while working in ArcMap have you had the need to find the XY coordinate for a certain location? Sure you can hover over the map with your mouse and read the coordinates displayed in the lower right hand corner of the ArcMap window:

xy1

But depending on your projection, those coordinates might not be in the format you want. For example, you want longitude and latitude but your coordinates are displayed in another projection system.

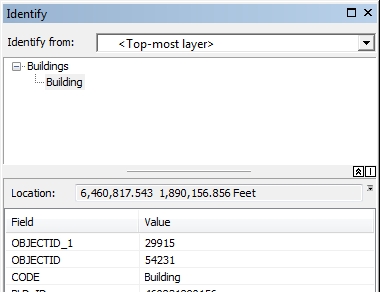
Here comes the Identify tool to the rescue! Identify tool you ask? Yes, besides displaying what features you clicked on it also displays the coordinates where you clicked. You have been using this tool for a long time but maybe overlooked the coordinate display. Try it now. Here is what I got:

xy2

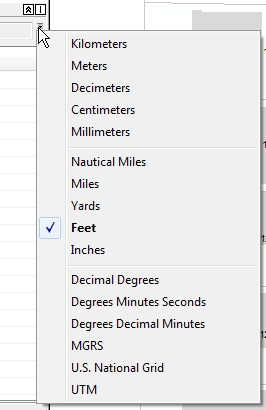
Note “Location:” just above the field and value listing. If you want to change the coordinate format, click on that little down arrow next to the coordinate display:

xy3

Now pick something else, like Decimal Degrees and see your new coordinates:

xy4

You can even copy what is displayed and paste it in something else, like an email or a report.

So there you go, a quick way of getting point and click XY coordinates from ArcMap. Enjoy! -mike

Master’s Thesis Grants

Applications for the next round of AAG Cartography Specialty Group Master’s Thesis Research Grants are due by June 15, 2014.

Masters students enrolled full time are invited to apply for the CSG Master’s Thesis Research Grants. These grants are intended to promote scholarly research in cartography by students enrolled in Geography or a related degree program. Grants are available up to a maximum of $500 and may be used for items necessary and relevant to research, such as travel, materials, equipment, and human subject fees.

Deadlines for application are March 15, June 15, and November 1 of each year. Applications and inquiries should be directed to the CSG Non-Academic Director, Sarah Bell, at sbell@esri.com.

For more information and the application form, please visit http://www.csun.edu/~hfgeg003/csg/master.html. You can also access that page from the Awards and Competitions section of the main CSG Web site, http://www.csun.edu/~hfgeg003/csg.

Please share this announcement with your students or other organizations that may have potential applicants.  Good luck in the competition!

Free Python eBook

Looking to learn Python or brush up on your Python skills?  You can download for free Mark Pilgrim’s book Dive Into Python.  Keep in mind this book is dated 2004 and uses Python 2.3 in the examples, but that should not stop you using the current version of Python and following along in the book.  Click here to view the table of contents of the book before you decide to download.

Geospatial LA Meeting June 4th

Group: Geospatial LA
Subject: Geospatial LA is THIS WEDNESDAY, June 4th @ CalTech – 5:30pm

Imagin’ Labs & PIXIA Corporation are hosting the meeting this Wednesday in Pasadena for an evening focused on imagery, sensor data collection, processing and remote sensing.

PRESENTERS:

  • Jet Propulsion Laboratory – Radar, Optical, and Crowd Remote Sensing for Rapid Disaster Response
  • Planet Labs – Small Sats and Commercial Applications
  • AeroVironment – Convergence of UAV’s and GIS
  • Pixia Corp. – UAV Imagery and Dissemination Technology
  • Imagin’ Labs – Corregistration of Satellite and Aerial Imagery for Change Detection
  • Teledyne Scientific Imaging – Digital Imaging Technologies for Multi-Modal Sensing and Exploitation

MEETUP DETAILS (hosted by Imagin’ Labs):
Date: Wednesday, June 4th Time: 5:30pm
Where: Caltech, 1200 E California Blvd, Pasadena, CA 91125 In the Buwalda room, first floor of the Arms building, which is building #25 on the campus map: http://www.caltech.edu/map/

Parking:
Free after 5pm in the campus structures, I suggest parking in structure #123 on the map, which is approximately at: 485 S Wilson ave, Pasadena, CA 91106

MEETUP SOCIAL (hosted by PIXIA Corporation):
When: Approximately 7:30pm – on
Where (New Location!): Lucky Baldwins Trappiste – 1770 East Colorado Blvd.

Nature Soundmap

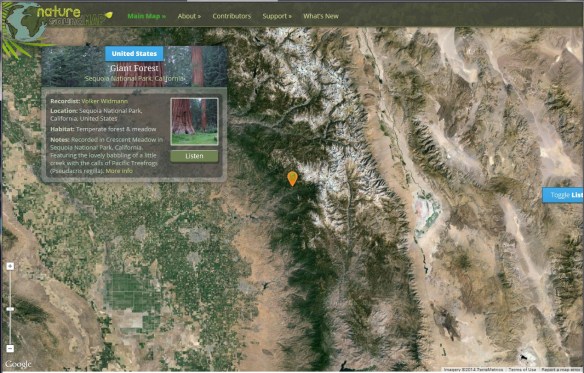
What does a humpback whale sound like? Or perhaps the White-cheeked Gibbon? The Nature Soundmap provides snippets of these sounds and much, much more. Visitors will find an interactive map of the world, complete with markers that allow audio wildlife travel from Central America to Central Asia. Symphonies of animal noises can also be found here. Each marker includes information about the animal or setting profiled, along with a link to More Info for the generally curious.  Click below to check it out.

soundmap

The Future of Programming: Wolfram Language

Stephen Wolfram has worked on the Wolfram Language for about 30 years now. The Wolfram Language is a knowledge based programming language. It’s a language with a vast amount of knowledge about how to do computations and it’s a language that has a model of the world built in. The symbolic nature of the language allows it to accommodate any style of programming. It can even use natural language. And it makes it really easy to create really powerful programs.

The goal of the Wolfram Language is to encapsulate as much computational knowledge as possible so people can go from ideas to deployed products as quickly and easily as possible. The Wolfram Language is a huge language, but it’s built on a small set of powerful principals:

  • Coherence – everything in the language must fit together.
  • Maximum Automation – the language should take care of as much as possible.
  • Symbolic Nature – allow the language to define and describe its own deployment.

You can run the Wolfram Language in the cloud and access it via mobile devices. You can take any Wolfram Language function and setup an instant API for it that you can call from anywhere on the web. For example, asking for a JSON output of some weather data for a user’s geo-location. The Wolfram Language can interact with connected devices using the Wolfram Data Framework (WDF).

And yes, the Wolfram Language has detailed maps of everywhere built in! This is the future of programming my friends! Check it out.

Disasters in the Golden State

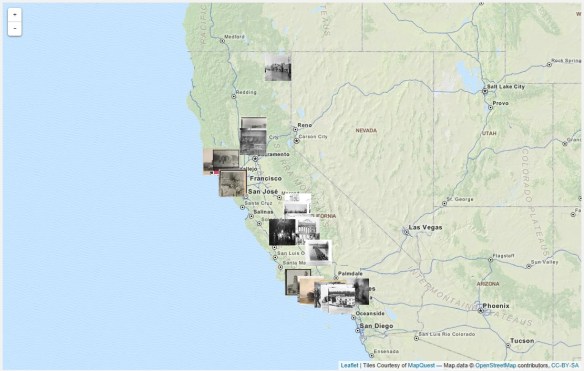
The talented archivists at Calisphere have curated a range of subjects on California history as part of their Local History Mapped series. This particular feature takes on Disasters in the Golden State by looking into the way disasters have affected buildings during the 19th and early 20th centuries. It’s a great subject and visitors can use the View Map feature to explore the state.

calisphere

The homepage provides a brief synopsis of each major disaster type, along with resources for teachers, including class activities based on thematic collections of these images. Additionally the site includes a helpful document titled “How to Use Local History Mapped” and some complementary links from the Joint Committee on Geographic Education.

That reminds me of this book:

It’s very interesting with first hand accounts of California disasters from 1800 to 1900.