How do you feel today? How was your commute into work? Feeling a little run-down because you lost an hour of sleep?

How do you feel today? How was your commute into work? Feeling a little run-down because you lost an hour of sleep?
Remember Arc/Info and coverages? Coverages were just features stored as files in a directory. Then along came ArcView with data stored in shapefiles, which was different. Then later ArcMap with the ability to store GIS data in Microsoft Access or an Enterprise Database like Oracle or SQL Server. Then came the File based Geodatabase, which was … dejavu … features stored as files in a directory.
Remember ArcView 1, 2, and 3.x? You saved your data view and multiple layouts to a project file (.APR file). Then later with ArcMap you saved your data view and one layout to an .MXD file. Then came ArcGIS Pro with … you guessed it … a .APRX project file to store all your work.
What’s next? When ArcGIS Pro first was released, you had to have a named user account in ArcGIS Online tied to an ArcPro license to use it. At version 1.2, ArcGIS Pro licensing now has more options. ESRI added licenseing the “old way”, with concurrent use and single use licensing options. For concurrent use licensing, you will need the 10.4 version of the License Manager running on a server like you do right now for your concurrent use ArcGIS Desktop licenses.
For more info on this, click here and a short video here.
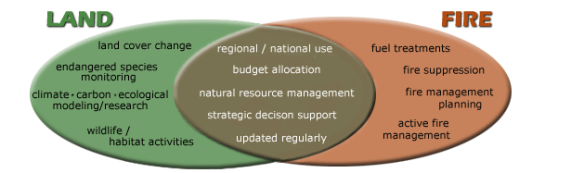
Do you manage or coordinate vegetation or landscape data sets such as field plot/transect data or disturbance/treatment polygons? If so, the LANDFIRE Program needs your data. LANDFIRE is an interagency vegetation, fire, and fuel characteristics mapping program, sponsored by the United States Departments of Agriculture, Forest Service and the Department of the Interior (www.landfire.gov). LANDFIRE data have served as an important data set for programmatic planning, analysis, and reporting for fire and natural resource management.
Is there anything new this year?
LANDFIRE had targeted January 2015 as the key start date for the upcoming remap effort but due to additional data advances with the USGS Land Change Monitoring, Assessment and Projection effort, LANDFIRE is adjusting the beginning of the remap and, as a result, extending the vegetation/fuel plot data call date to March 31, 2016. LANDFIRE is evaluating changing the annual data submission date from January to March for future data calls.
Why should we submit data for remap?
LANDFIRE will be remapping data products with new imagery and new vegetation/fuel plot data to reflect contemporary conditions. There is still time to get your plot data in LANDFIRE, so geospatial landscape data are as reflective of on the ground conditions as possible. Additional plot data have a great potential to improve the quality of the data products especially in areas where lower/limited plot data were available for LF National (circa 2001). For more information on areas that had lower/limited plot data visit: http://www.landfire.gov/participate_plot.php. Locally provided data impact LANDFIRE products and evidence is available for review at http://www.landfire.gov/lf_impacts.php.
What types of data are needed?
Vegetation and Fuel Plot Data:
In preparation for the upcoming remap, LANDFIRE needs contributions of any geo-referenced point, transect, or polygon vegetation or fuel plot data along with any associated digital photos, project descriptions, or final reports. For more information on LANDFIRE’s plot data needs visit http://www.landfire.gov/participate_plot.php where examples of these data and relevant attributes can be found.
Polygon Disturbance and Treatment Activities from 2015/2016:
LANDFIRE uses recent disturbance and treatment data to update map layers in areas where vegetation and fuel have changed. At a minimum, the disturbance/treatment polygons must be attributed by disturbance/treatment (Event) type and year of occurrence. For more information, visit http://www.landfire.gov/participate_contribute.php where examples of these data and relevant attributes can be found.
In addition, LANDFIRE also welcomes feedback on current data products, for more information visit http://www.landfire.gov/participate_feedback.php .
Data Submissions, Contributions, and Thanks:
LANDFIRE collects and welcomes data submissions on an annual basis throughout the year. The data submission deadline has been changed to March 31, 2016 for this data call. Data submitted before March 31 are evaluated for inclusion in the appropriate update cycle, and submissions after March 31 are typically considered in subsequent updates. That said, due to production schedules and the amount of data that needs processing, opportunities to include data that may not have been submitted by the cut-off date often arise. Don’t hold back. Submit data any time.
For more information visit http://www.landfire.gov/participate_refdata.php or contact Brenda Lundberg, LANDFIRE Reference Data Administrator, blundberg@usgs.gov, (406) 329-3405.
LANDFIRE also acquires data from websites and agency data base systems. For a list of these sources see the “Website Agency DB” spreadsheet at http://www.landfire.gov/participate_refdata_sub.php. For a list of past data contributions see the “Compiled Data” spreadsheet at http://www.landfire.gov/participate_refdata_sub.php.
LANDFIRE thanks those who have contributed data in the past and is again asking for your help to enhance and improve LANDFIRE products through your data or information contributions.
Hello Everyone:
USGS has a program underway to receive and review crowdsourced data for certain building structure types. Our National Map Corps is managing the Volunteered Geographic Information (VGI) program. VGI provides an editing environment that allows interested persons to add, delete, and modify structures in the USGS structures database. The online VGI editor is based on the popular Open Street Map interface and anyone who is interested can sign up for an account to help us update structures and improve the quality of our data for future release to the public.
Structure types available for editing include schools, colleges/universities, fire/EMS stations, police stations, correctional facilities, state capitol buildings, hospitals, ambulance services, cemeteries, and post offices.
The VGI effort covers all 50 states (though not the Pacific Territories). Your Pacific Region National Map liaisons plan to host a webinar to introduce the VGI program to anyone who is interested in possibly contributing their knowledge of structures to our mapping program. Data contributed through VGI will be vetted by USGS and will reside in the USGS structures dataset. The structures data are available to the public and also appear on USGS products such as new US Topo maps (http://nationalmap.gov/ustopo/index.html)
To read the latest on VGI and help whet your appetite for contributing data please see the VGI newsletters here: http://nationalmap.gov/TheNationalMapCorps/newsletters.html
We are planning to offer this one hour webinar on Thursday, March 31 at 1:00 PM PDT (1:00 PM MST, 10:00 AM HST). To attend this meeting, you must first register for it. Please click this link to see more information, and register for the meeting.
https://usgs.webex.com/usgs/j.php?RGID=rae74b50d93b96bc85f825658d822c340
Once you have registered for the meeting, you will receive an email message confirming your registration. This message will provide the information that you need to join the webinar.
Thanks and please contact us with any questions,
Carol Ostergren
Drew Decker
—————————————————————–
Drew Decker
National Map Liaison for Pacific Region
U.S. Geological Survey
4165 Spruance Road
San Diego, CA 92101
619-225-6430
ddecker@usgs.gov
USNG 11S MS 8026 2158
Carol Ostergren
US Geological Survey National Geospatial Program
CSUS—Placer Hall
6000 J Street Sacramento, CA 95819-6129
916-278-9510
costergren@usgs.gov
Some of the new functionality added to the ArcGIS for Local Government solution:
Many more enhancements as well. Click here for more info.
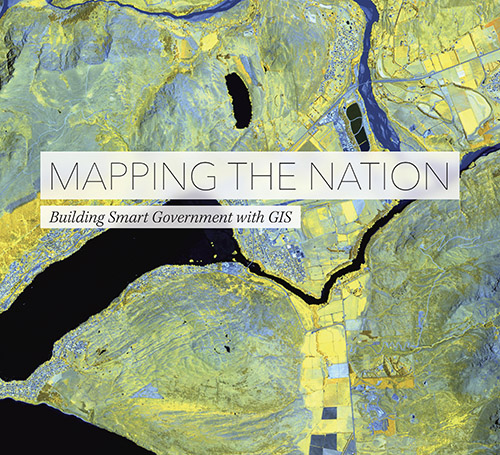
Mapping the Nation: Building Smart Government with GIS, a new book from ESRI, illustrates the many ways government uses maps created with geographic information system (GIS) technology to create safer, healthier, and more resilient communities.
This is the 6th book in ESRI’s Mapping the Nation series. Chapters of the book are devoted to over 100 maps related to public safety, public policy, national mapping and statistics, education, health, the environment, and humanitarian work.
The US Bank Tower in downtown LA (formerly Library Tower and First Interstate Bank World Center) is a 73 story, 1,018 foot tall skyscraper at 633 West Fifth Street and is the tallest building west of the Mississippi River (11th tallest in the US). The building was constructed from 1987 to completion in 1989.
For many years I wondered why the tallest building in downtown LA never had an observation deck. It was a bummer not to have one, especially on our tallest building! But finally in July 2014, the owners of the skyscraper announced construction of an observation deck on the 69th and 70th floors, a restaurant on the 71st floor, and a glass slide outside to slip from the 70th floor to the 69th!
It should all be ready for you to try out by mid-2016. Check it out!

And if you wait until 2017, the new 73 story Wilshire Grand being constructed now will have its own sky-high observation deck and restaurant, plus an infinity pool on the rooftop!
ESRI has supersized their Small Government Enterprise License Agreement (SGELA) which now includes local governments serving populations up to 250,000.
With an ELA, you have access to ESRI’s core products (Desktop, Server, Engine, Runtime) and extensions, with as many installs of the software that you need. You also get an ArcGIS Online account for your organization, Portal for ArcGIS, CityEngine, access to ESRI Developer Network (EDN), Virtual Campus dollars for web training, instructor-led training discounts, and User Conference passes. All for a pretty reasonable price per year for 3 years. For example, Tier 4 runs about $50,000 per year. Get your SGELA today and start expanding your organization’s access to GIS services and products!
Today is leap year day! Every 4 years (well, almost … read on) we have an extra day in February (the 29th) added to the calendar. For those that have wondered why, here are some interesting facts:
Why do we have leap years?
A leap year, where an extra day is added to the end of February every four years, is down to the solar system’s disparity with the Gregorian calendar. A complete orbit of the earth around the sun takes exactly 365.2422 days to complete, but the Gregorian calendar uses 365 days. So leap seconds, and leap years, are added as means of keeping our clocks (and calendars) in sync with the Earth and its seasons.
Julius Caesar vs. Pope Gregory
The Roman calendar used to have 355 days with an extra 22-day month every two years until Julius Caesar became emperor in the 1st Century and ordered his Alexandrian astronomer Sosigenes to devise something better. Sosigenes decided on a 365-day year with an extra day every four years to incorportate the extra hours, and so February 29th was born.
Why does the extra day fall in February?
All the other months in the Julian calendar have 30 or 31 days, but February lost out to the ego of Roman Emperor Caesar Augustus. Under his predecessor Julius Caesar, February had 30 days and the month named after him, July, had 31. August had only 29 days. When Caesar Augustus became Emperor he added two days to “his” month to make August the same as July. So February lost out to August in the battle of the extra days.
Refining the system about 500 years later
As an earth year is not exactly 365.25 days long, Pope Gregory XIII’s astronomers decided to lose three days every 400 years when they introduced the Gregorian calendar in 1582.
What about leap seconds?
Leap years are not directly connected to leap seconds, but both are for the purpose of keeping the earth’s rotations in line with our clocks and calendars. Leap seconds are added to bring the earth’s rotation into line with atomic time. A leap second was added at the end of June last year, when immediately before midnight dials read 11:59:60.
Atomic time is constant, but the Earth’s rotation is gradually slowing down by around two thousandths of a second per day. Leap seconds are therefore crucial to ensuring the time we use does not drift away from time based on the Earth’s spin. If left unchecked, this would eventually result in clocks showing the middle of the day occurring at night.
The extra second can sometimes cause problems for some networks which rely on exact timings. When a leap second was added in 2012 Mozilla, Reddit, Foursquare, Yelp, LinkedIn, and StumbleUpon all reported crashes and there were problems with the Linux operating system and programs written in Java.
A leap year isn’t every 4 years
The year 2000 was a leap year, but the years 1700, 1800 and 1900 were not. There’s a leap year every year that is divisible by four, except for years that are both divisible by 100 and not divisible by 400. The added rule about centuries (versus just every four years) was an additional fix to make up for the fact that an extra day every four years is too much of a correction.
So far the math has worked ever since but the system will need to be rethought in about 10,000 years’ time. Perhaps when robots take over they will think of something for us!
ESRI has released World Geocoder for ArcGIS. World Geocoder for ArcGIS enables users to securely map global addresses behind a firewall so that sensitive data is never exposed.
World Geocoder for ArcGIS has several key benefits for organizations in addition to protecting sensitive data. It includes an API that can be used to add geocoding capabilities to ArcGIS apps and custom apps. World Geocoder for ArcGIS has been designed to geocode addresses from multiple countries, using a single locator, for a flat, fixed price. Licenses come in Basic (250 million geocodes per year), Standard (3 concurrent batch jobs), and Advanced (8 concurrent batch jobs) levels.
