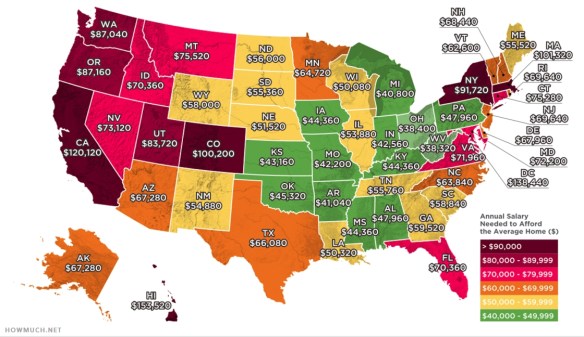
Looking to buy a home in California? You will need to make $120,120 per year to afford an average home. Check out this article and map of the US showing what your annual salary must be to afford an average home.

Looking to buy a home in California? You will need to make $120,120 per year to afford an average home. Check out this article and map of the US showing what your annual salary must be to afford an average home.
Interesting article on mapping and assessing landscape suitability for bee migration. GIS and remote-sensing applications can help to assess and map landscape as well as beekeeping suitability to allow precision beekeeping and hence the promotion of colonies. Check it out!

ESRI is hosting a webinar series dedicated to the trends, technical advancements, best practices, and special topics relating to GIS in public safety. Each webinar highlights a different subject relevant to your organization’s missions, workflows, and operations. Upcoming webinars include the following:
Visit the ESRI Public Safety Webinar Series website to register for upcoming events and stay up to date with GIS solutions for public safety agencies.

The Center for Spatial Studies at UCSB is hosting a poster and plenary session on campus on June 6th. The Plenary session will be on “Improving Information Accuracy for Extreme Events”. For more info and to RSVP, click below.

The California Geographic Information Association (CGIA) Board nominations are still open, but will close at the end of the day tomorrow. Nominate yourself or someone that would like to run for the following openings:
Board Officer positions open for nominations:
Board Member Categories open for nomination:
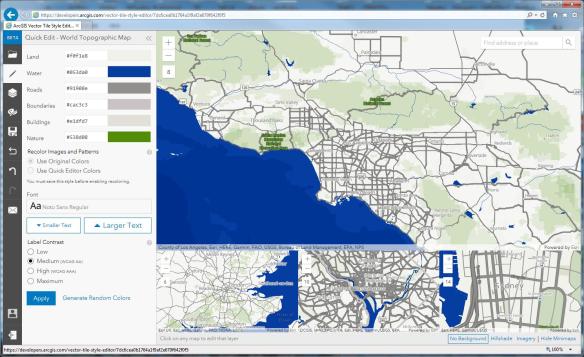
ESRI has announced the release of the ArcGIS Vector Tile Style Editor, available in beta on the ArcGIS for Developers website. The tool gives you a fast and easy way to create a custom basemap style.
By selecting an existing vector basemap, you can customize the layer colors and labels. You can edit everything from fill and text symbols to fonts, halos, patterns, transparency, and zoom level visibility. When you are finished, the styles are saved as an item in ArcGIS Online with a unique ID. The map viewer or any custom application can then reference the ID to display the basemap. Check it out.
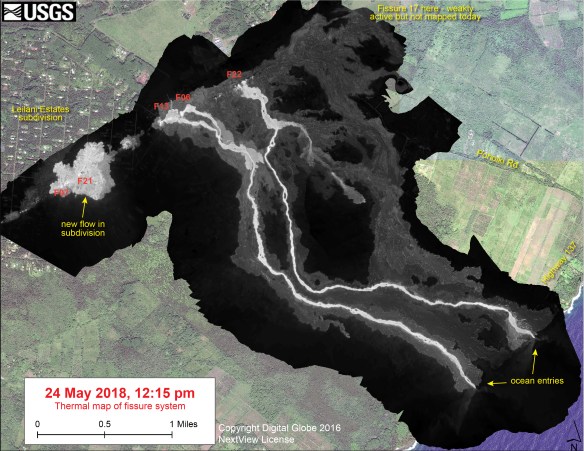
With all that is going on in Hawaii, the USGS is keeping up by mapping the fissure systems and lava flows of the eruption at Kilauea. They also have been taking thermal images so you can really see where the lava is flowing. Check it out!
Wanting to catch a look at some wildflowers in SoCal? You might still have some time. Check out this app by SCAG. Using precipitation, windstorm, natural habitats, and open space data, they mapped likely wildflower blooms and potential superblooms. You can also overlay transit data to plan your trip!

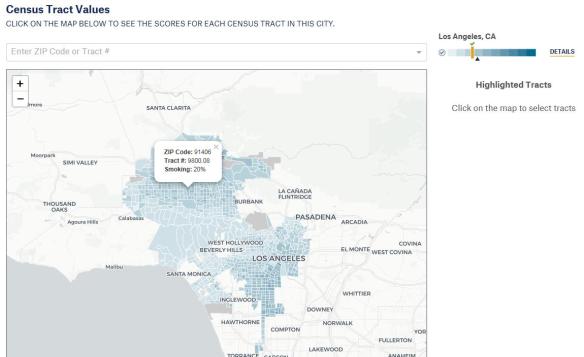
The City Health Dashboard is an online resource with community-level health, social, and economic data for the 500 largest cities in the US. The dashboard reports on 36 key measures of health, such as obesity and opioid overdose deaths, as well as the conditions that influence health, such as housing affordability and reading proficiency. The dashboard represents a first of its kind effort to provide city and neighborhood level data from multiple national sources, creating a one stop online resource to help city leaders and residents pinpoint and take action on gaps in health and opportunity. Check it out!
Interesting article about mapping the ocean floor. I did not know that only 15% of the ocean floor has been mapped so far. An idea to “crowd source” ocean floor mapping is taking hold, using volunteer cargo ships, fishing boats, and pleasure craft to transmit data in real time.