In a recent survey of citizens across the world it was found 86% view digital delivery of public services “as equally or more important” than traditional methods of public service delivery. And most are willing to provide personal or potentially sensitive data to improve the personalization of services. For example, 73% of citizens polled would provide biometric data such as fingerprints, retinal scans, or voice identification to government in exchange for more personalized service. Of course Americans were about 10 percent less likely than their global counterparts to share personal information to improve government service delivery … I don’t blame them! Click below to read more.
Harvard University’s Center for Geographic Analysis (CGA) has created Harvard WorldMap, an online open-source mapping platform developed to lower barriers for scholars who wish to explore, visualize, edit, and publish geospatial information. WorldMap was created to provide a mapping platform that supports large datasets that also allows collaboration. Anyone can create their own online mapping portal, upload large GIS layers and overlay them with other layers, and control access to their data. Check it out!
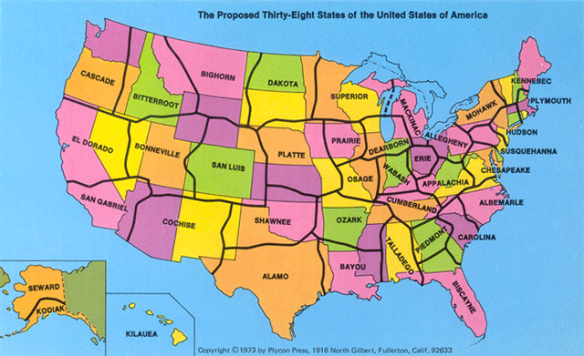
In 1973, a California State University geography professor suggested that the US redraw its state boundaries and reduce the number of states to 38. State lines were to be drawn in less populated areas, isolating large cities and reducing their number within each state. Thus with fewer cities vying for state tax dollars, more money would be available for projects that would benefit all citizens. Alas, the idea died in Washington. Click below to read more about it.
If you do not have the cash to attend the GIS-Pro/CalGIS 2018 conference in Palm Springs next week, you can get a free pass to visit the exhibit hall area October 10 or 11. Click here for more details.
FEMA and FCC will conduct a nationwide test of the Emergency Alert System (EAS) and Wireless Emergency Alert (WEA) system. That means today you will receive a WAS test message on your cell phones that are connected to wireless providers participating in WEA. Cell towers will broadcast the WEA test for approximately 30 minutes beginning at 2:18pm EDT (11:18am PDT).
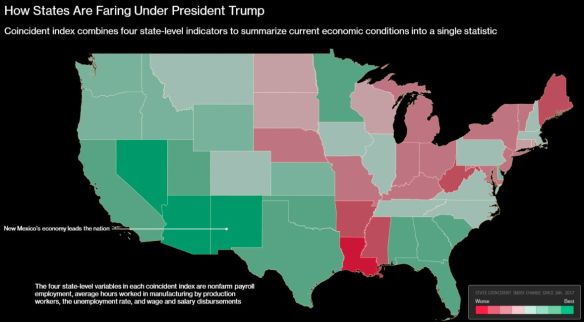
According to an analysis of Federal Reserve Bank of Philadelphia data, the top five states that lead other states in economic gains since President Trump’s inauguration in January 2017 are New Mexico, Nevada, Arizona, California and Georgia. Click the map below to read the short article.
What would be interesting is another map showing what it was before Trump, or a map showing % change.
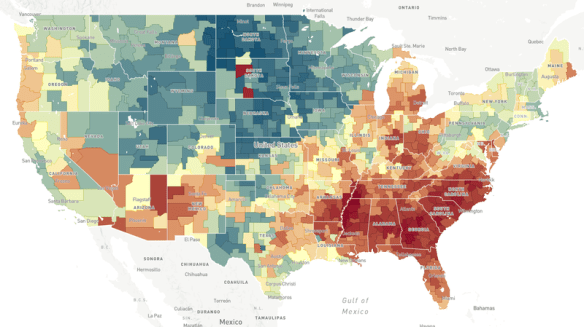
Does the neighborhood you grow up in determine how far you move up the economic ladder? Check out this NPR article and interactive map to explore the Opportunity Atlas.
In a recent poll, more than 10,000 burger fans nationwide were asked to name their favorite burger from a major fast food establishment or restaurant chain. Though the map does not show you the distribution of fast food chains, or lack of certain ones, it does show you people’s preferences in their region. Check out the Burger Map!
What is ArcGIS Indoors? ESRI calls it a complete indoor mapping system that will offer a floor aware location platform providing maps, data, and location info for indoor spaces. Scheduled for release in Q4 of 2018, ArcGIS Indoors is targeted for use in facilities, retail and commercial locations, airports, hospitals, event venues and universities, to analyze, locate, navigate, and to collaborate and share indoor information.
To use ArcGIS Indoors for real time indoor positioning and routing directions, the building you are in needs to be equipped with location technology that connects to your phone or tablet where the app is running. The location technology is not part of the ArcGIS Indoors system, but is needed for it to work. ESRI stated that it has used Apple’s location technology for prototype versions of the system.
The ArcGIS Indoors mobile app is an essential part of the system. The app uses a mobile map package that is hosted in ArcGIS Online. The map package contains all the indoor location info relevant to the building, such as CAD/BIM data, points of interest, transportation networks and vector baselines. The logic of the different building floor levels are defined in Excel spreadsheets, as well as points of interest and feature class information.
Right now there is no quick way of generating an indoor location information model. A variety of data sources can be used to create one, but it would probably be best just to start from scratch if no data exists. If you are familiar with the Campus Viewer Tools, you have some knowledge on what needs to be done. ArcGIS Pro will be used to create information models in a two step process. First you create a lattice network that covers all walkable spaces in a building. Second, this serves as the basis for a thin lattice network with more details, using a special set of toolboxes in ArcGIS Pro. Once created, you push the output to ArcGIS Online as a mobile map package to be consumed by the ArcGIS Indoors app.
Watch this video of the ArcGIS Indoors workshop from the last ESRI User Conference. It will give you a great overview on what you need to do with respect to data and getting it all working:
Also click below for more info on ArcGIS Indoors and sign up to stay informed when it’s released.
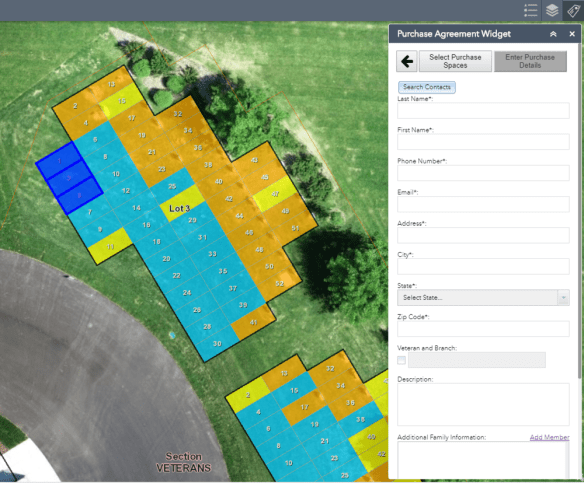
Have a need for cemetery plot management? Check out this Web AppBuilder widget that is a workflow app, from available plots, PDF reports, purchasing status, and search capabilities.