From govloop.com and ESRI, a very cool infographic on how GIS technology powers our daily lives.
Sea Level Rise and Coastal Flooding Impacts
Take a look at the Sea Level Rise and Coastal Flooding Impacts application from NOAA.
Besides setting sea level rise up to 6 feet, you can also display levels of confidence of the inundation areas, flood frequency, and socioeconomic vulnerability of nearby communities.
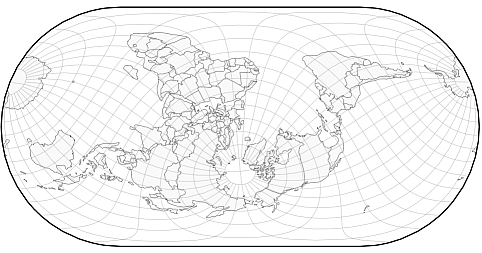
Map Projection Transitions
Interesting tool for viewing different map projections.
The globe is live in the tool so you can grab it and turn it to see the distortions near the edges. Best viewed in Chrome or Firefox.
First Look Image from the Landsat Data Continuity Mission
The USGS announced the first look image from the Landsat Data Continuity Mission (LDCM). The image captures both the host institution of the NC CSC, Colorado State University, as well as the Galena fire scar just west of CSU. The NC CSC is a member node of the NASA Applied Sciences DEVELOP program and the director, Jeff Morisette, worked at NASA Goddard Space Flight Center for 10 year prior to joining the USGS. The center is integrating climate observations and models with remote sensing observation to help meet its mission of bringing the best available earth science to help land managers within the Department of Interior. See the full press release for more info.
Code Enforcement Goes High-Tech
Interesting article about using GIS, permit data, and LIDAR at the street level to find unpermitted signs and construction.
First ArcGIS for Local Government Meet-Up
ESRI is starting an ArcGIS for Local Government Meet-Up. It will be in Redlands on April 17th, 2013 at 11am.
Summer 2013 GIS Courses at UCLA
If you need a GIS course or two, try one of these this summer at the Department of Geography at UCLA:
GEOG 7 – Introduction to GIS
GEOG 168 – Intermediate GIS
GEOG 170 – Advanced GIS
See the Geography Schedule of Classes for times and fee info.
Open Records Law vs GIS Data and Copyright-protected Software
Another interesting case, this one in Ohio about access to government GIS data. Read about it here.
Geocortex User Group Meeting
The Southern California Geocortex User Group Meeting is today at 1:30pm in Alhambra at LA County DPW. Hope to see you all there.
USGS National Map Viewer – New Data and Resources
Hello everyone:
USGS operates the National Map Viewer (nationalmap.gov/viewer) as a national GIS data resource. The site has long offered viewing and download access to a number of individual basemap layers (imagery, elevation, land cover, boundaries, hydrography, etc.). Recently, some new capabilities have been added providing more utility to GIS users.
1. Contour lines – the same contour lines shown on the new 1:24,000-scale US Topo can now be downloaded as vector files for use in GIS. The contour lines are available in a shapefile format. Contour lines are pre-staged in one degree blocks for quick retrieval.
2. Download Options – have been expanded to include selecting areas by a bounding box or by specifying coordinates (in decimal degrees). The site has supported the ability to download data by reference region (such as county or quadrangle or watershed) or by the map viewer extent. Now these additional options make it easier to select data for the exact region you need.
3. More maps and data to view and download – in addition to the contour lines mentioned above. National Map Viewer had added an elevation availability basemap layer which can be toggled on and off. This lets users know what resolution of elevation model is available (such as 1/3 arc-second (10m)) for a given area. Another improvement is the ability to download scanned topographic maps from the historical topographic map collection, which you will see as an option under the “available data for download window.”
We invite everyone to visit the National Map Viewer and see these new additions. And, as always, if you have any questions or need help locating or downloading data please feel free to contact us anytime. Thanks,
Drew Decker
Carol Ostergren