Here is an interesting article about why cartography still matters today. Check it out!
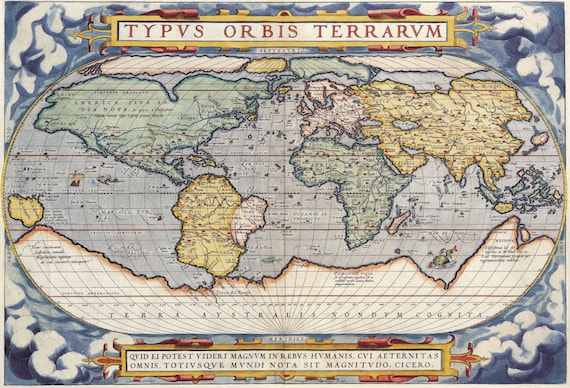

Here is an interesting article about why cartography still matters today. Check it out!
On September 29, from 5pm to midnight (PDT), ESRI plans to update ArcGIS Online. The update includes streamlined item sharing with groups, configurable tabs in the navigation bar, more reports for admins, and improvements in ArcGIS Configurable Apps.
| Configurable tabs in the navigation bar Administrators will be able to configure which tabs appear in their organization’s navigation bar for both members and visitors. Hiding unused tabs will help simplify the user experience. |
| Additional reports for administrators Asynchronous reporting continues to expand in ArcGIS Online giving administrators more ways to monitor and assess activity.
|
| Streamlined item sharing with groups Group owners and managers will be able to batch add items to a group. |
| ArcGIS Configurable Apps improvements ArcGIS Configurable Apps with express setup (Media Map, Minimalist, Interactive Legend, Zone Lookup, Nearby, and Attachment Viewer) continue expanding to make sharing your maps quick, easy, and insightful. Planned improvements include Support for Google Analytics. Screenshot widget that allows you to capture the entire app including the pop-up and legend. |
The ESRI Infrastructure Management & GIS Conference will be held virtually October 27-30, 2020. The conference will welcome GIS leaders, managers, and professionals across critical infrastructure industries including electric, gas and pipeline, water, telecom, transportation, and architecture/engineering/construction (AEC).
The conference is complimentary for all ESRI users who are current on their maintenance or subscription. For more info and to register, click below!

URISA’s GIS-Pro 2020 will be held virtually on September 29 to October 2. Because it will be virtual this year, the cost to attend has been reduced. For more info and to register, click here.
If you studied Geography/Cartography at any of the colleges in SoCal in the 80’s and 90’s, you might remember Professor Norman Thrower at UCLA. You also might remember his book “Maps and Civilization”. Professor Thrower turned 100 years old last year. Sadly he passed away on September 2, 2020.
Check out this article written last year about him.
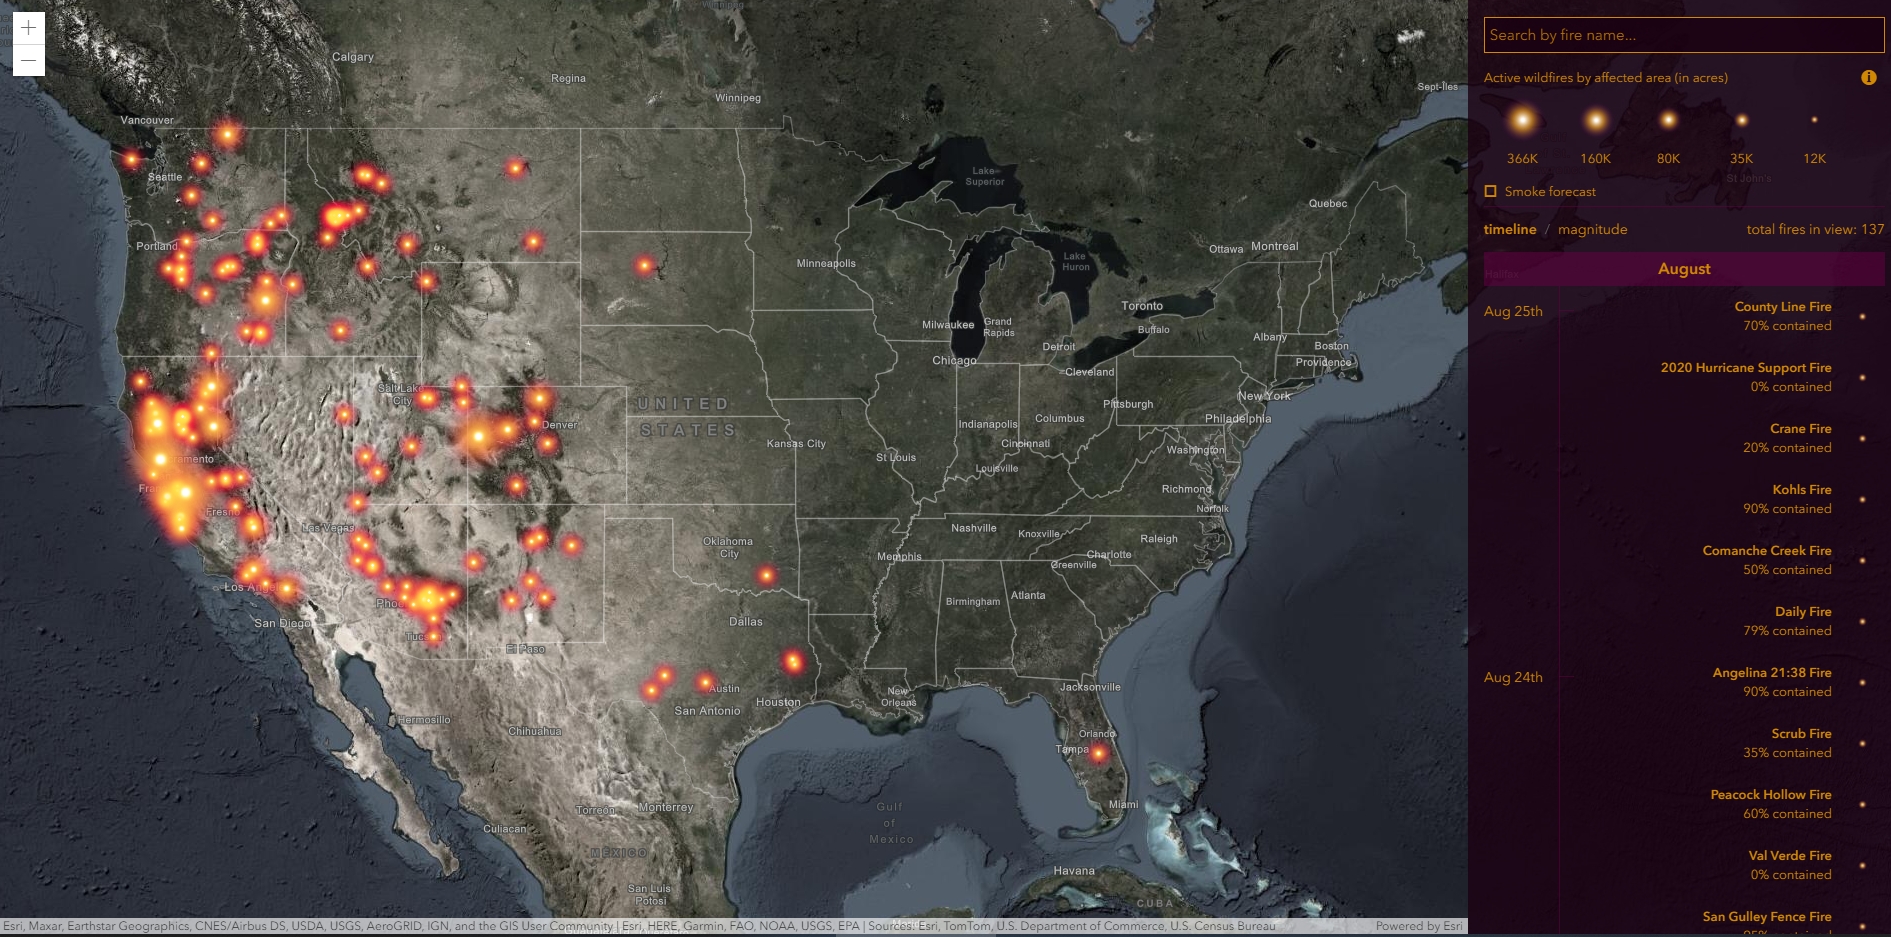
If you are looking to track fires in California, stay on top of warnings from local fire officials, and find the latest information on traffic and smoke forecasts, then these interactive maps will help you keep on top of it all.
Cal Fire: This page brings you real-time updates on fire location and containment, as well as updates on evacuation orders and other news.

ESRI Wildfire Story Map: This interactive map uses geolocation tools to track a fire’s coordinates and lets you look up additional data like smoke forecasts.
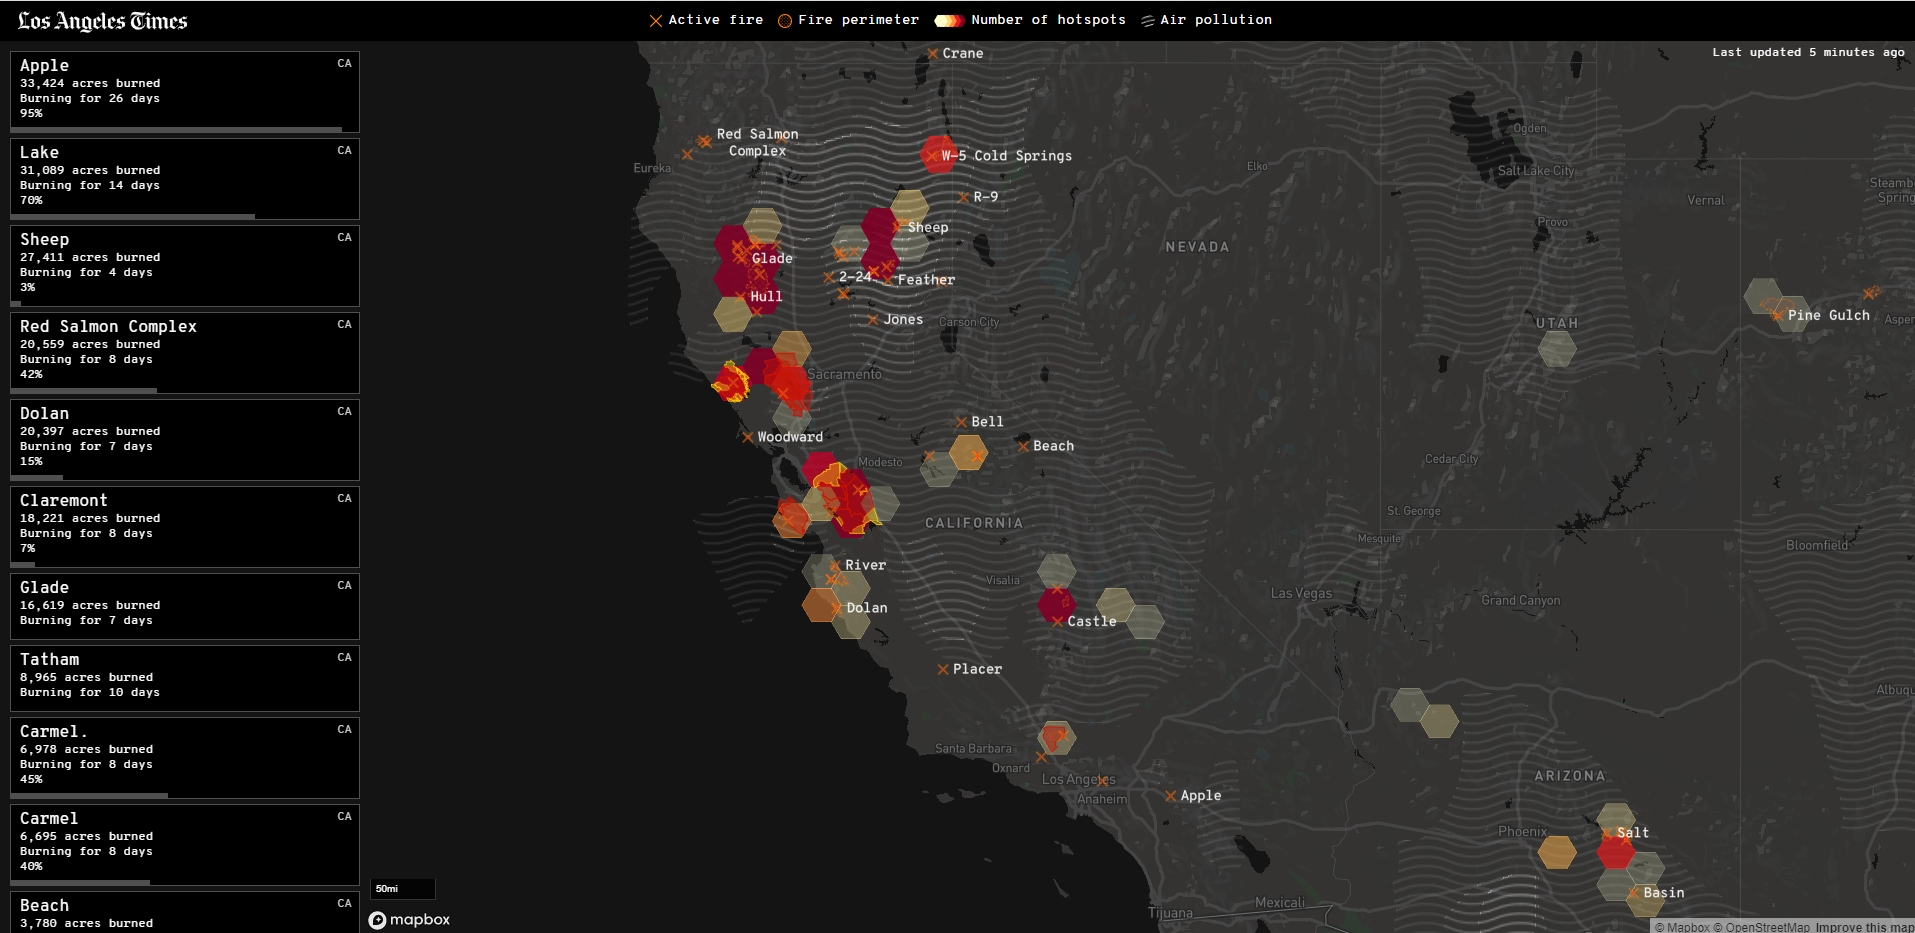
Los Angeles Times: A great source for local fire info, with a nice interactive map and tools.
I remember 30 years ago working on ESRI’s COGO software. If you ever used it back in the day, you were a hero creating a landbase from scratch with only measurements from tract and parcel maps and making sure everything closed well with your traverses.
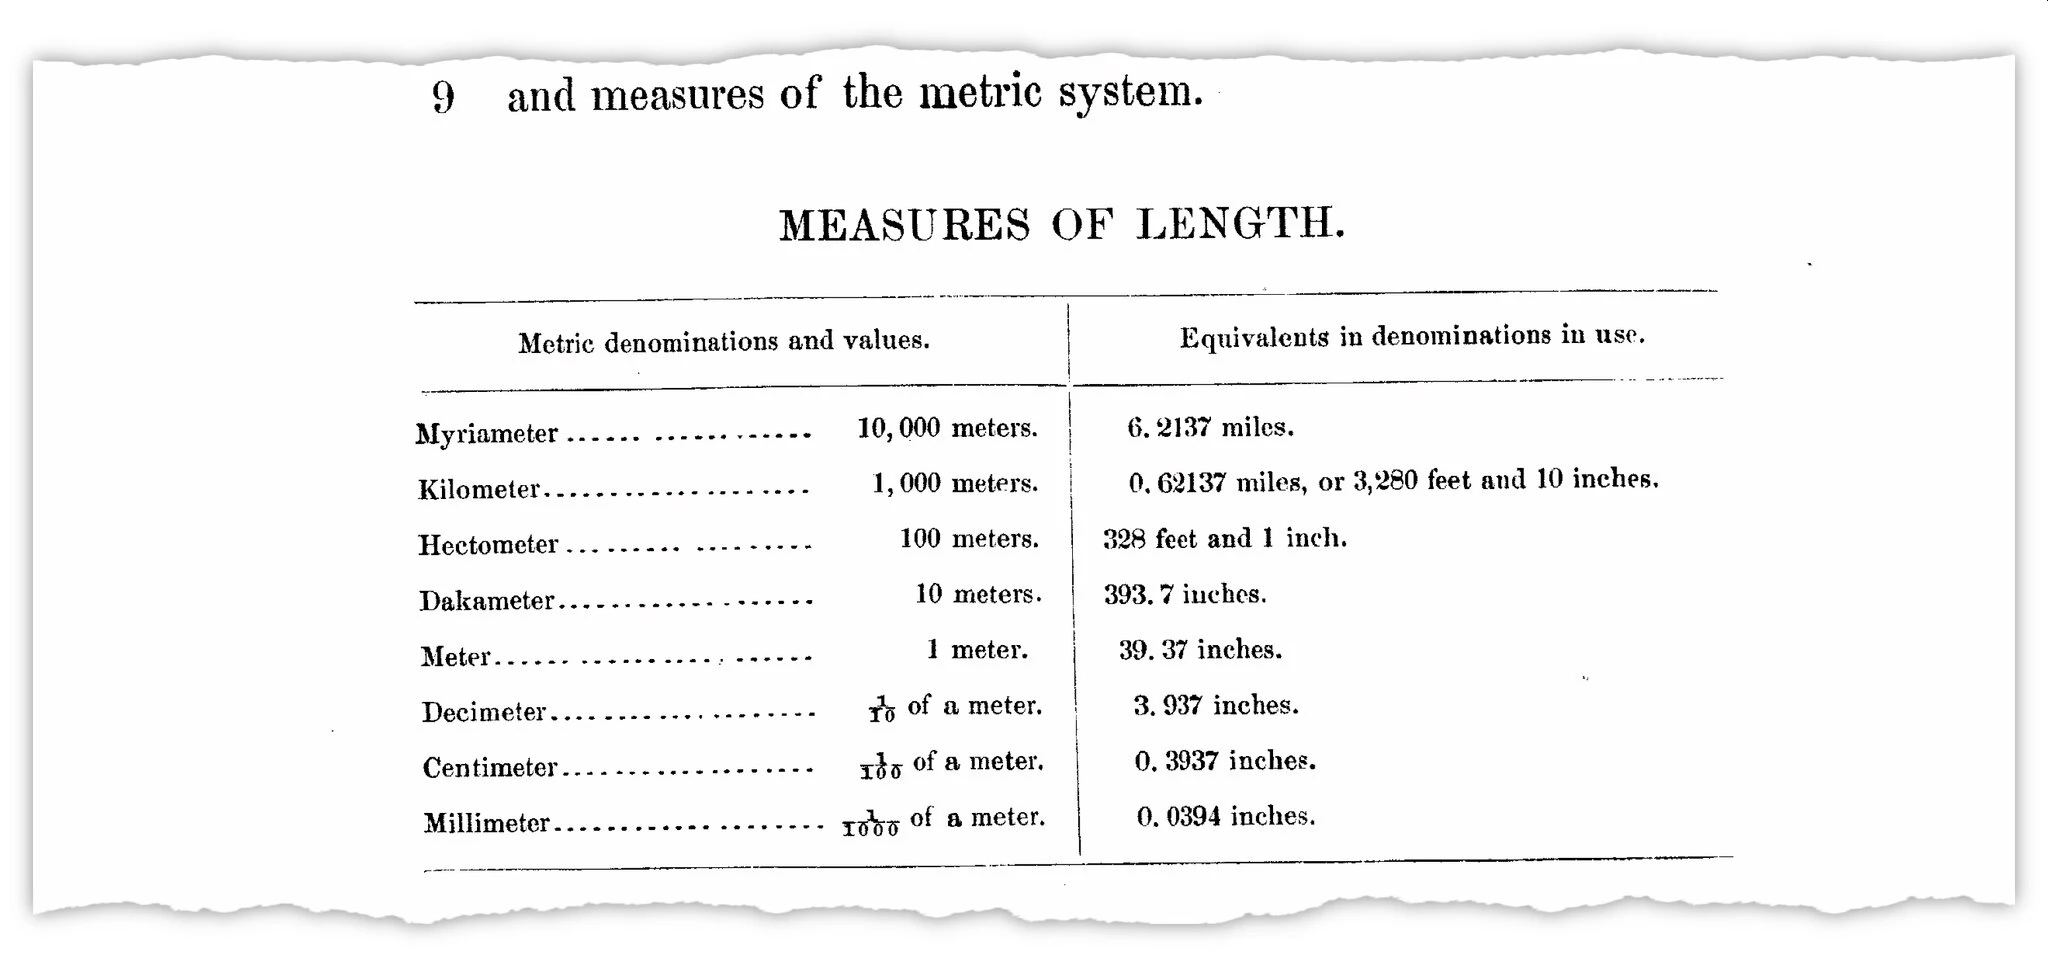
One thing I found interesting was there were two definitions for measuring 1 foot. There was the international foot, which was defined as 1 inch = 2.54 centimeters exactly, or 1 foot = 0.3048 meters exactly. The other was the older US survey foot, which was defined as 39.37 inches = 1 meter exactly, or 1 foot = approximately 0.304800609601 meters, or multiplying US survey feet by the fraction 1200/3937 to get meters.
The US survey foot has been around since 1893 while the international foot was established in 1959 and is slightly more exact. One of the reasons we retained the US survey foot was because of our state plane coordinate systems, which were derived from the national geodetic control network, and are based on the relationship of 1 meter equaling 39.37 inches exactly. Fundamental survey units, such as rods, chains, statute miles, acres, sections, and townships, all depend on the relationship of 1 meter equaling 39.37 inches exactly.
Using two measurements for the same unit have been confusing over the years. But now the US survey foot will be obsolete by January 1, 2023. Click below to read more about it!
Besides Google’s Community Mobility Reports, Apple has their own data on COVID-19 Mobility Trends. Their data was generated by counting the number of requests made to Apple Maps for directions in select countries/regions, sub-regions, and cities. The thought is as COVID-19 lock downs go down, direction requests go up. Check it out!
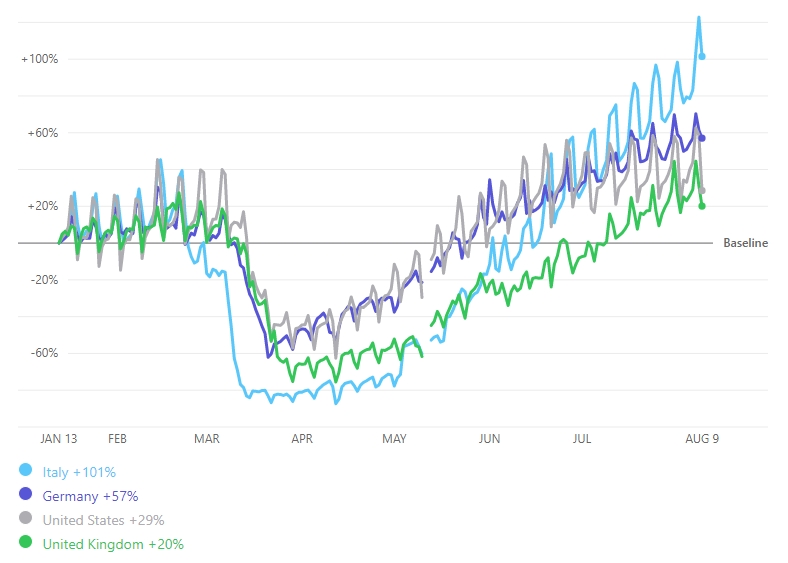
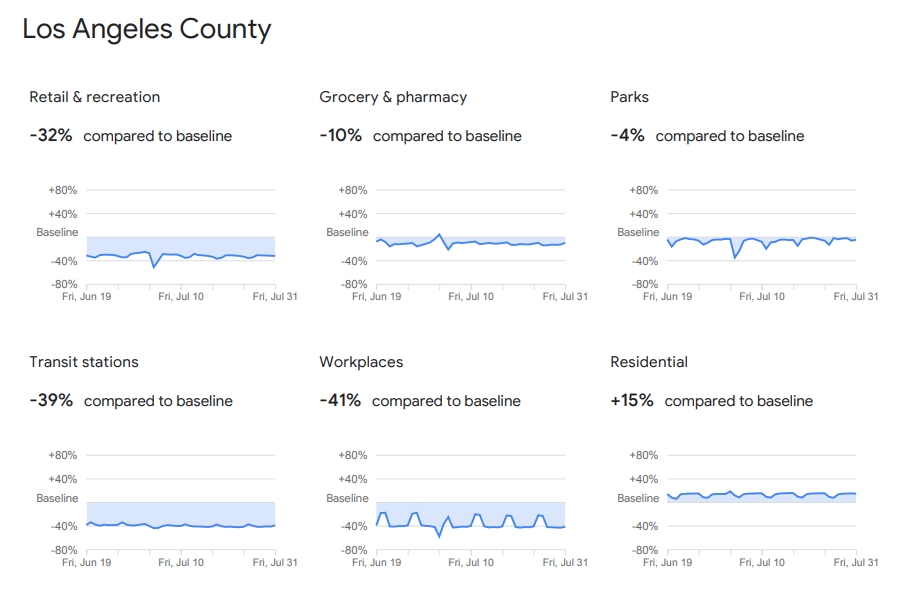
Check out Google’s Community Mobility Reports that provide insights into how people’s movements in countries around the world were altered during the lock down period of COVID-19. Also you can see mobility change since countries have eased movement restrictions.
The reports use aggregated anonymized data from mobile phones to chart trends in movement over time. They show how visits to different venues (like retail, groceries, parks, transit stations, etc.) have been effected by government lock downs. Check it out!
An overview and how to understand the data can be found here.
