Looks like the Geoloqi team at ESRI has some time on their hands! Place dots on a map, download the app on your phone, then run around to gobble up the dots and get points. It is still in beta and will be available soon.

Looks like the Geoloqi team at ESRI has some time on their hands! Place dots on a map, download the app on your phone, then run around to gobble up the dots and get points. It is still in beta and will be available soon.
Here is a collection of images showing all kinds of map designs, from realistic to the fantastic. The examples cover a broad spectrum of cartographic delights and curiosities. For artists, cartographers, and map enthusiasts it’s a wonderful gallery of mapping concepts.

David Frank McCarter has launched a Kickstarter campaign (http://kck.st/1ahHrcE) to crowd fund his new artistic wall map of California, “The Beautiful Counties of…California”, which uses California paintings from the mid-1800s to the early-1900s to represent California’s 58 counties.
“The paintings in the map were chosen to provide the map reader with a sense of place and history of this beautiful and geographically diverse state,” says McCarter. “For example, a painting of Mt. Shasta is used to represent Siskiyou County; California Redwoods for Del Norte and Humboldt Counties; scenes of Pomo Indians in Colusa and Lake Counties; and forty-niners in several of the counties that had large goldfields during the California Gold Rush. The map was made to do more than just show where places are, it was made to tell a story of the places themselves.”
A table is provided on the right hand side of the map which lists the artists and their paintings that are used. Some of the famous artists that have paintings in the map include Albert Bierstadt, Edwin Deakin, Grace Hudson, Thomas Hill, and Charles Christian Nahl.
The map includes the county boundaries, county seats, and important cities of California. It measures 24” x 36” (standard frame size).
If the project’s goal of $2000 is reached, the money will cover the cost of printing and shipping. He will also donate 100 of these California wall maps to elementary schools in low-income school districts in California to be used as educational tools in the classroom. For a $20 pledge, the contributor receives a map (shipping included) – other pledge levels are also available.
About David Frank McCarter
“I’ve always been passionate about cartography, art, and the warm place where the two disciplines intersect,” McCarter says. “While studying Geography and Cartography at California State University, Northridge, I developed a unique mapping style that fuses cartography with fine art to create maps that are enjoyable and educational for people of all ages.” Two of his previous maps of this style (“The Fifty Colorful States of the…United States of America”, and “A Glimpse into the World of…Vincent Van Gogh”) have won international awards at the ESRI International User Conference. His California wall map, “The Beautiful Counties of…California”, is his latest map of this style.
Contact:
David Frank McCarter
Email: David@DavidFrankMaps.com
Website: http://www.davidfrankmaps.com/
Facebook: https://www.facebook.com/davidfrankmaps
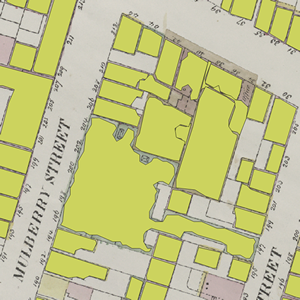
Have some paper maps that you need to extract features for GIS … and attributes as well? Check this work out by NYPL Labs on GitHub!
GreenInfo Network’s CPAD has been updated and is ready for download or use through a web service – go to www.CALands.org for details. The new data set expands the number of agencies with holdings to almost 1,000 and adds significantly in San Diego County, plus many other improvements. This data version (CPAD 2013b) also has more detailed subtypes for agencies (you can now query for “Land Trusts” and other sub types), and an initial default Gap (biodiversity) rank field. You can review and comment on the data, and take a simple online evaluation survey at www.CALands.org/revise. Questions? Send email to cpad@calands.org.
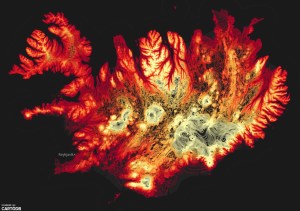
Here’s why Iceland is one of the most amazing places on Earth: It is the only spot where a mid-ocean ridge can be seen above water. Check out the cool map and notebooks too.
Interesting maps showing broadcast areas for NFL, College Football, and MLB games.
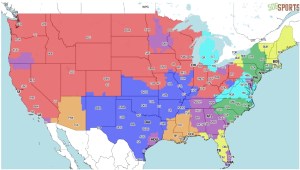
Thanks goes to Tom Lutgen at Burbank Water & Power for finding this site. He poses the question “Interesting to see the market boundaries for each team – like, why is San Diego the only SoCal market to get the Atlanta-Miami game on Fox? Advertising bucks at play I suppose”.
Last year, a pair of researchers from Duke University published a report with a bold title: “The End of the Segregated Century.” U.S. cities, the authors concluded, were less segregated in 2012 than they had been at any point since 1910. But less segregated does not necessarily mean integrated–something this incredible map makes clear in vivd color. Read the Wired article here.
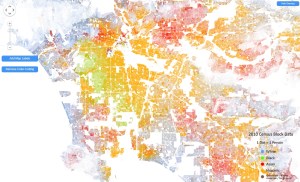
Thanks to Mike Mercurio’s GIS student Alexi Elconin for finding this one!
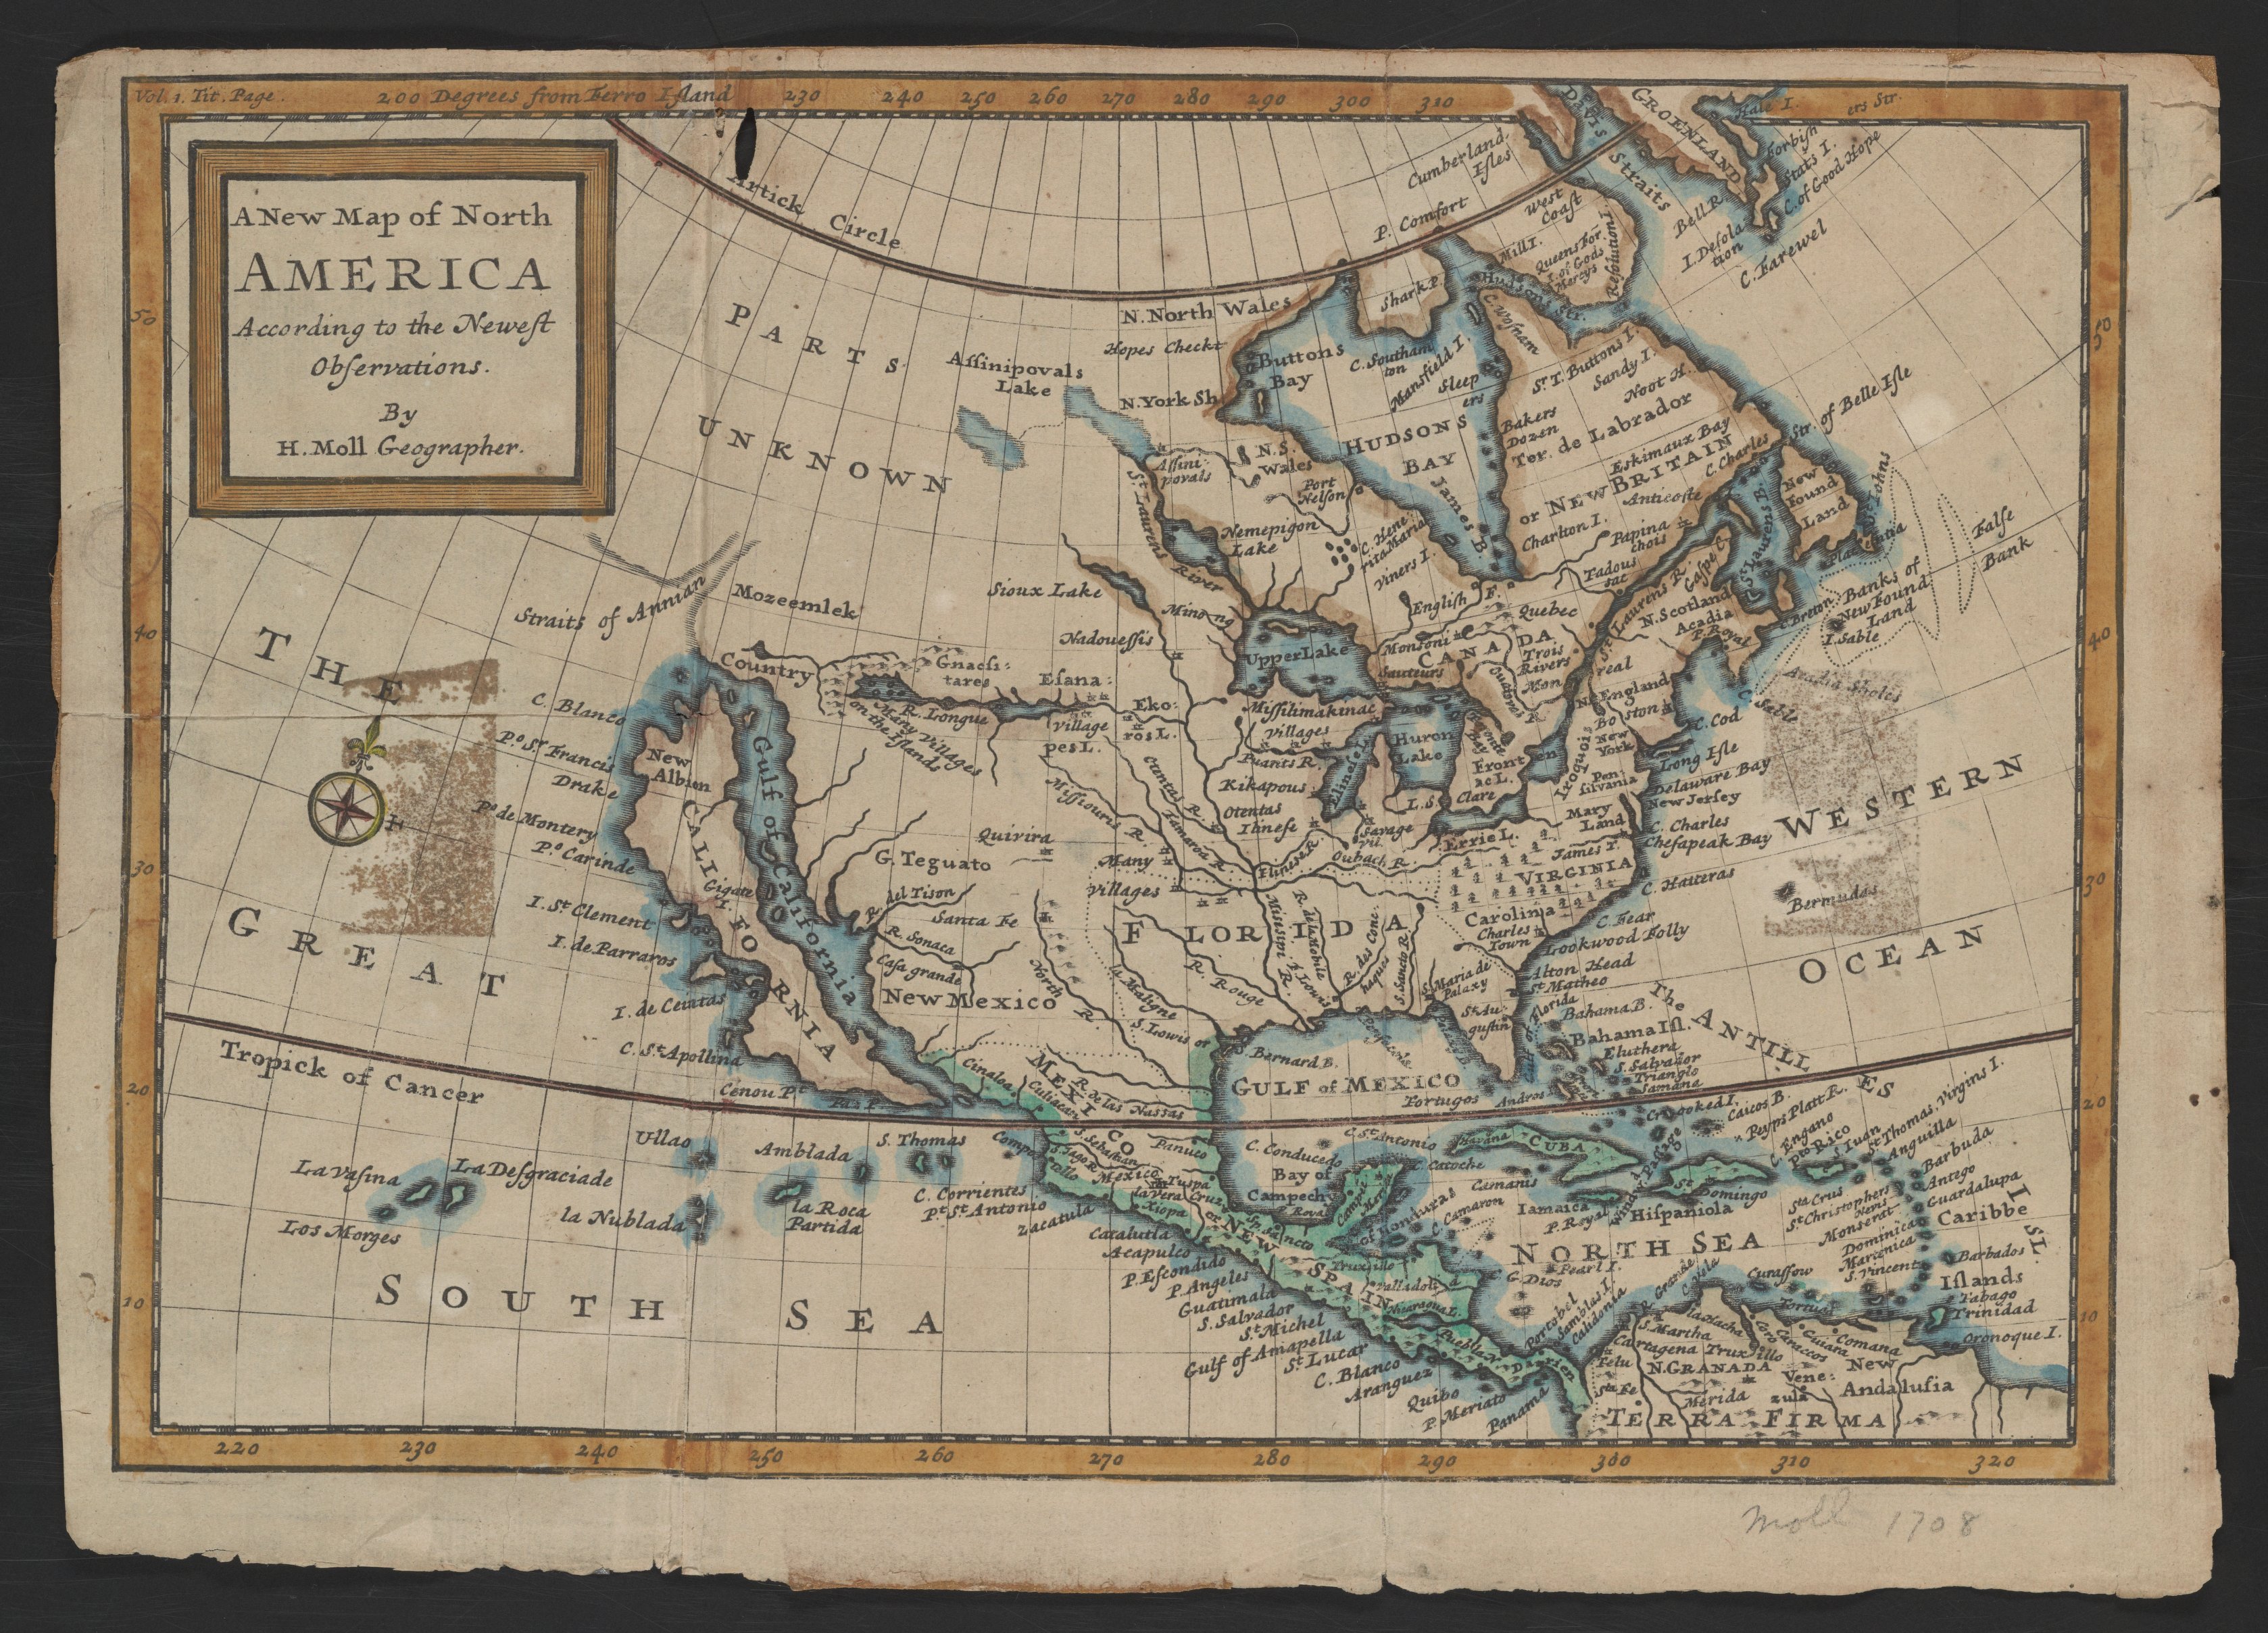
The Glen McLaughlin Map Collection of California as an Island is now available online. The 731 maps were collected by Glen McLaughlin over a period of 40 years and acquired by Stanford University in 2012. It is the largest known private collection of maps showing California as an island. It is now available for anyone to search, find, view and download via the Stanford University Library’s catalog. Please visit californiaisland.stanford.edu to read more about the collection.
Burbank GIS put together a golf course app for their public DeBell Golf Club.
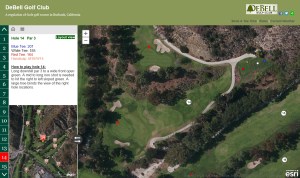
It was a fun app to work on. It utilizes ESRI’s Countdown Storytelling Template, ArcGIS Online, and Burbank’s public GIS server running ArcGIS Server and a PostgreSQL geodatabase.
If your GIS shop has been working on any apps, announce it here too! -mike

