Ok, this is a new one for me! Never heard of “technical debt”. I think it is more of a marketing ploy, but you be the judge. Click below to read the article.


Ok, this is a new one for me! Never heard of “technical debt”. I think it is more of a marketing ploy, but you be the judge. Click below to read the article.
The National Maps Corps is an online crowdsourcing mapping project with volunteers successfully editing structures in all 50 States, Puerto Rico, and the U.S. Virgin Islands. Structures include schools, hospitals, post offices, police stations, cemeteries, and other important public buildings. By updating and verifying structures data, volunteers are making significant contributions to USGS National Structures Database, The National Map, and ultimately US Topo Maps.
If you have some time, why not do a little data editing? Click below and check it out.

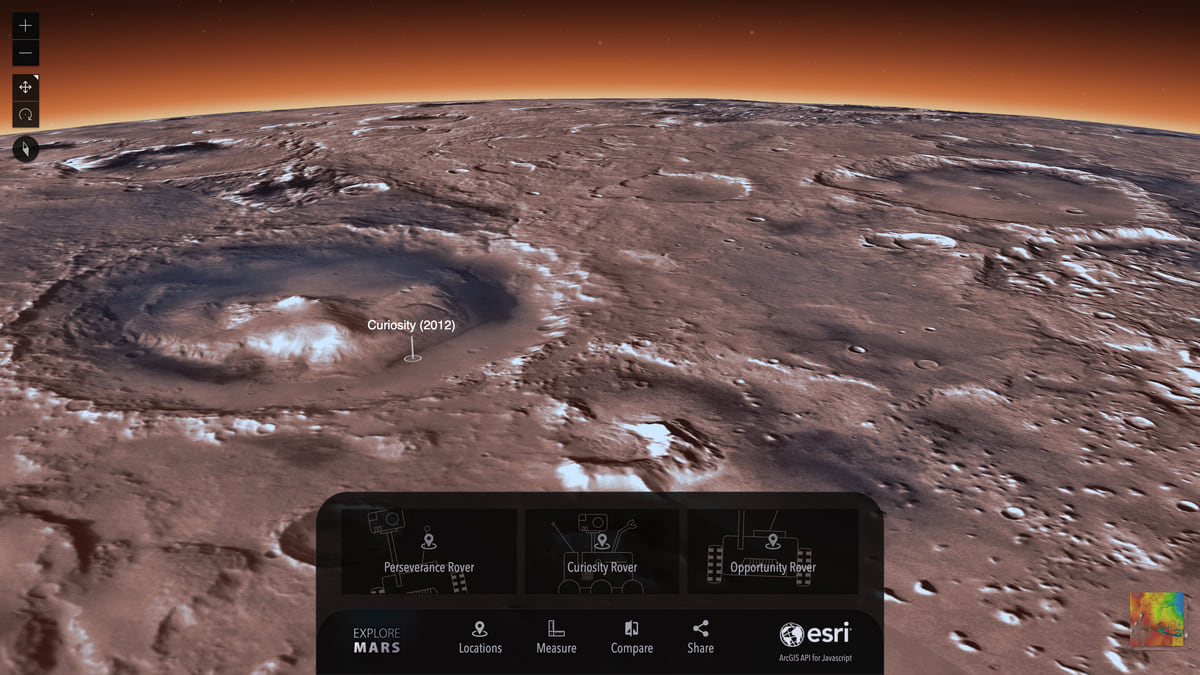
Check out this ESRI blog post about adapting planetary coordinate systems to then view in a 3D globe application like for Mars.
The OGC membership recently approved the new Indoor Mapping Data Format (IMDF). Read about it here.
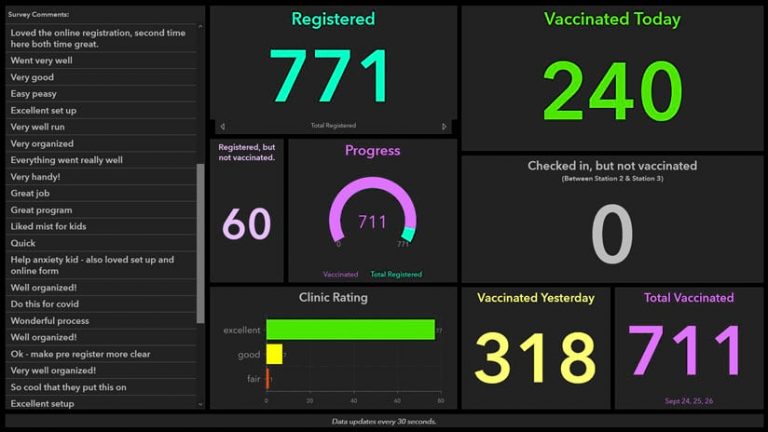
This one is interesting. The GIS Department for Carlton County, Minnesota, used ArcGIS Survey123, ArcGIS Hub, and ArcGIS Dashboards to help administer a drive-through flu vaccine clinic. Online forms created with ArcGIS technology made registration for the clinic safer, faster, and easier for the public. Dashboards provided real-time statistics, enabling county officials to quickly analyze how many people were being vaccinated. Click below to read the article.
Join the ArcGIS Earth team on February 24 for a technical session at the ESRI Federal GIS Conference to introduce the newest capabilities available in ArcGIS Earth. Whether you’re a first-time user or a seasoned professional, this session is designed to bring value to all ArcGIS Earth users by delivering a product overview as well as a demonstration of some of the newest, most exciting capabilities currently available, and a sneak peek into what’s on the roadmap. The session will be followed by a live Q&A with the product team to field all your questions related to ArcGIS Earth. Click here for more info and to register.
Here is an interesting site that shows power outages across the US. PowerOutage.US collects, records, and aggregates live power outage data from utilities all over the United States, with the goal to create the single most reliable and complete source of power outage information available. Click on a state and get county level information, including number of homes that are out of power and what power companies are having issues. Very interesting!

SCAG is inviting college and university students in the region an opportunity to conceptualize, create, and submit ArcGIS StoryMaps using SCAG’s open data. This is a meaningful way to tell a story or provide insight, showcase plans and projects, engage supporters and stakeholders, illustrate the possibilities of data, and highlight the usefulness of open data at the regional level.
The 2021 Student Showcase will be a virtual StoryMap competition with two award categories: Innovation and Planning. An internal staff of planning professionals will evaluate the projects and select four winners.
In all, there will be a total of $6,000 awarded (one $2,000 first place prize and one runner-up $1,000 prize each per category).
Want to learn more about ArcGIS StoryMaps? Attend the Toolbox Tuesday on StoryMapping: Transforming Data Into Interactive Stories on Tuesday, Feb. 23 at 10 a.m. Attendance is encouraged but not required. Entrants may also review meeting materials that will be posted online following the training to participate.
If you are looking at developing your cartography skills, why not take this free MOOC (Massive Open Online Course) in Cartography, presented by ESRI. You will learn how to make beautiful maps using ArcGIS Pro. You get free access to ArcGIS Pro and ArcGIS Online.
The class has already started, Feb 3, but you can still jump in. Just register by Feb 14. Check it out!
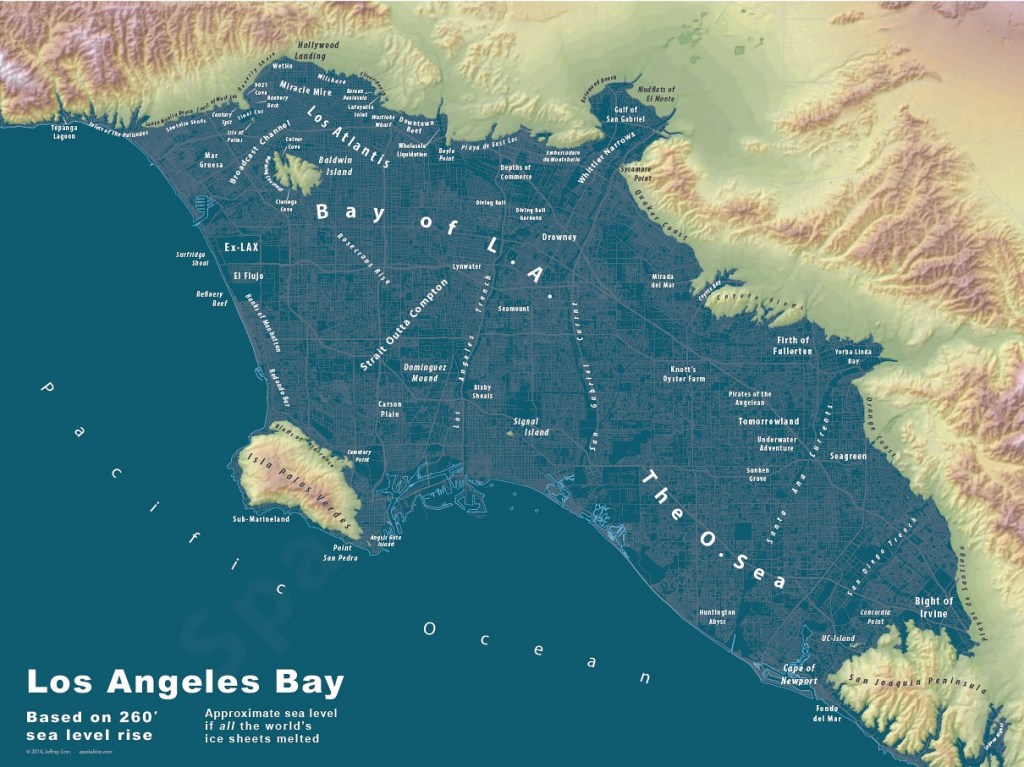
One of our members pointed out this hilarious map. Based on a sea level rise of 260 feet. I like some of the place names like “Mudflats of El Monte”, “Huntington Abyss”, and “Knott’s Oyster Farm”. Could be a nice place!
More images by the artist can be found here.
