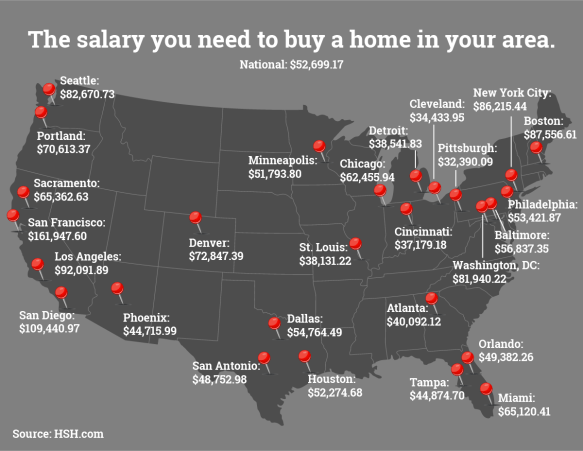
How high does your salary need to be to comfortably buy a house in your city? In LA, it looks like you need to be making $92,091.89. The mortgage database HSH put together this map that analyzes the salary needed to buy a home in different parts of the country. The map is based on the median home prices in metro areas including the surrounding suburbs, and assumes you will have a 30 year fixed rate mortgage with a 20 percent down payment and be able to afford the base cost of owning a home (principal, interest, taxes, and insurance).
Forget about food if you buy in San Francisco!