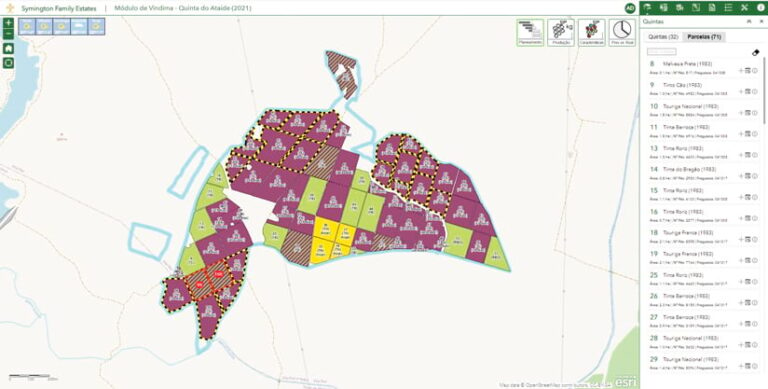
Unknown's avatar

About socalgovgis - Michael Carson

Michael Carson, GIS Manager (retired) for the City of Burbank and President of Southern California Government GIS User Group. Currently teaching GIS at College of the Canyons in Santa Clarita.

MXD – Set Data Sources

On occasion we have a need to change the data sources for the layers in our MXD files. Some MXDs have quite a few layers, so it would be a pain to go through each one in ArcMap and change them. This might happen to you when your source data is moved to let’s say a new enterprise geodatabase and now you have to update your MXD files.

If you have not done so before, try the Set Data Source(s) tool in ArcCatalog. Just navigate to where your MXD file is, then right click on it and select the Set Data Source(s) option:

The tool will open showing you the data frames and all the layers including their current data sources.

Continue reading

2022-23 CGIA Community Council Coordinating Committee Nomination

The California Geographic Information Association (CGIA) is looking for nominations for their new Coordinating Committee. The Coordinating Committee assists the Chair and Vice-Chair in the governance of the Council “on internal business matters such as developing agendas for Council meetings, maintaining the Council website, supporting communications, holding elections, responding to requests from Council members or constituencies, and establishing workgroups.”

Nominations close at 5:00 pm Friday, September 30, 2022. For more information, visit their announcement here.

Be Wildfire Aware

As wildfire season heads into its peak in late summer and early fall along the west coast, web cartographers at ESRI have created a new Wildfire Aware interactive mapping app. The app tracks wildfires across the country and reports on their impact to people, property, and the natural world. The app includes data from different agencies, including the Environmental Protection Agency (EPA), NASA, the National Weather Service, the U.S. Census, and the U.S. Fish and Wildlife Service. For each fire, you can scroll through data that shows how long the fire has been burning, how much acreage it has burned, how many personnel have been deployed, and what percent contained it is, as well as other data including what type of landform it covers, how much biodiversity is present, and how much carbon could be lost. Check it out!

US Interagency Elevation Inventory

The USGS National Geospatial Program is again updating the US Interagency Elevation Inventory. If you have elevation data, they would like you to give them information so that your data is discoverable by others. Your data need not be in the public domain, and the entry will provide a link to inquire about the data, or to a download site if available. This is not a repository for data; it is a way to make data findable.

Click here for more information and links on the CGIA website.

Tracking Active Wildfires

Wildfires can be sparked by a number of sources, including naturally via lightning strikes or simply by heat from the sun, but experts say most are caused by humans.

Many Earth-observing satellites can detect the heat signatures associated with wildfires. NOAA’s N-20 satellite passes over every spot on Earth at least twice a day and can detect fires with 375-meter accuracy.

Check out this wildfire app that displays hotspots and fire activity in real time in the US and Canada, and within 3 hours for the rest of the planet.

Webinar – Regional Planning with ArcGIS Urban

Date: August 24, 2022
Time: 9:00 a.m.–10:00 a.m. (PDT)

In this webinar you will hear from planning staff at regional groups (counties, councils of government [COG], and others) on how they are applying GIS-enabled tools to meet these challenges:

  • Exploring the impact of density bonuses
  • Visualizing and evaluating proposed developments
  • Assessing regional growth patterns and capacities
  • Supporting local planning projects

Click here to register.