GIS Day is Wednesday, November 18th. If you are looking for a site to visit, check out this interactive map for the SoCalGIS area (and beyond).

Location data from gisday.com.

GIS Day is Wednesday, November 18th. If you are looking for a site to visit, check out this interactive map for the SoCalGIS area (and beyond).
Location data from gisday.com.
Get your Professional Certificate in GIS at UC Riverside Extension. They have been offering the GIS Certificate since 1993! Check them out!
http://www.extension.ucr.edu/academics/certificates/geographic.html
I had to throw this one on here. Check out the James Bond Travel Map!

Free webcast today, starts at 11am PST! Hurry and sign up!
Southern California’s Shrinking Salton Sea: Mapping, Managing and Mitigating New PM10 Air Pollution Sources
Abstract:
The Imperial Irrigation District (IID) Water Conservation and Transfer Project includes a long-term transfer of up to 303,000 acre-feet of water annually from IID to the San Diego County Water Authority, and the Coachella Valley Water District. The Water Transfer Project, along with other factors affecting Salton Sea inflows and water balance, will result in accelerated exposure of the Salton Sea floor. As the Sea continues to recede, there is potential for windblown dust emissions from the exposed dry lakebed (the playa). A significant portion of this windblown dust is PM10 (particulate matter with an aerodynamic diameter of 10 micrometers or less). PM10 are approximately 1/7th the thickness of a human hair, are small enough to be inhaled, and represent a potential human health risk.
The Salton Sea Air Quality Program is focused on monitoring and mitigating dust emissions from exposed Salton Sea playa. Remote sensing is a key component of this program, and will be used to map playa surfaces, vegetative cover, and active dust source areas. Learn how satellite, aerial and UAV images all contribute to this effort and how they are being processed using Trimble eCognition image analysis software. The presentation will also discuss dust control pilot projects, such as Surface Roughening, and the remote sensing techniques used to inform design and evaluate dust control effectiveness.
Need access to Tract and Parcel maps for a particular property? Maybe you want to incorporate Tract and Parcel map data in your applications? Take a look at the Land Records data provided by the Los Angeles County GIS Data Portal. The data has links to thousands of scanned documents online.
Here you can download shapefiles with links to Tract maps, Parcel maps, Records of Survey, Township plats and Landgrants, Subdivision activity, and City boundaries. Most of the data seems to be updated every quarter.
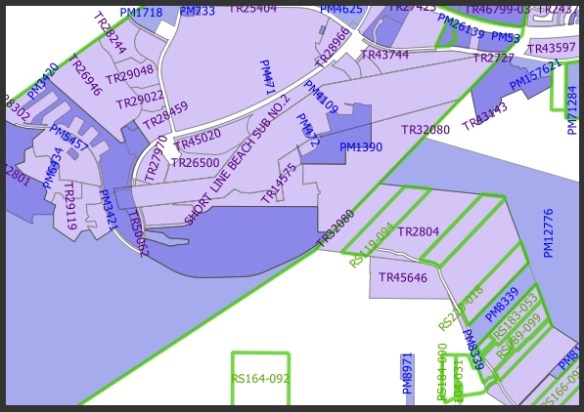
You can also take a look at their Land Records Viewer too.
After you view the Halloween Candy Map, check out this one showing the craziest urban legends from each state!

Interesting map showing each state’s favorite Halloween candy. The online survey was conducted in September with a total of 42,238 users. The candy that polled the highest was Reese’s Peanut Butter Cup.

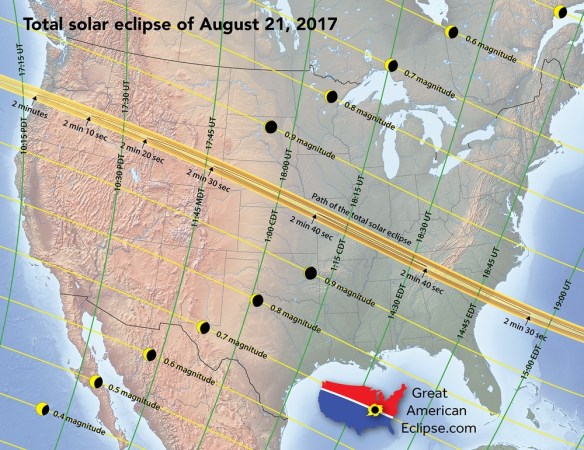
On August 21, 2017, the continental United States will experience a rare total solar eclipse that sweeps the nation from Oregon to South Carolina. Taking 94 minutes for the Moon’s shadow to race across the country, the duration of the total solar eclipse can last from 2 minutes near Depoe Bay, Oregon, to 2 minutes 41 seconds (the max) near Carbondale, Illinois, and 2 minutes 30 seconds near Awendaw, South Carolina. This will not happen again in the US until 2023 for an annular eclipse and 2024 for a total eclipse.
To help you plan your trip, take a look at these many maps including a 10 foot long strip map of the eclipse path. For more info, click below.
Interesting interactive map showing gun deaths in the US. The map is based on data from the U.S. Centers for Disease Control and Prevention and shows the average number of gun deaths per 100,000 county residents from 2004 through 2010.

Note that the “gun deaths” map combines homicides, suicides, and accidents. There are also separate maps for suicides and homicides. Suicides really skew the statistics.
Thanks to Barry Waite of the City of Carson for finding this one.
If you work with transit data, you might want to take a look at the following blog post. Some great suggestions:
Check it out.
![]()
