Have a need for cemetery plot management? Check out this Web AppBuilder widget that is a workflow app, from available plots, PDF reports, purchasing status, and search capabilities.
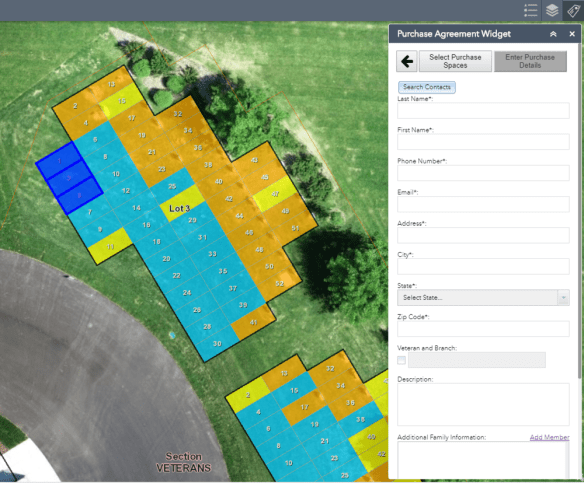

Have a need for cemetery plot management? Check out this Web AppBuilder widget that is a workflow app, from available plots, PDF reports, purchasing status, and search capabilities.
Have a need to look at historical imagery? Try ESRI’s World Imagery Wayback Archive. Click below to learn more.

Check out this interactive map of wind speed showing the hurricane on the east coast right now:

You can click on the map to get the current wind speed. Thanks goes to Tom Lutgen at Burbank Water and Power for pointing this out.
Check out the full disk image of the Earth and also check out Hurricane Florence on NOAA’s site.

Also check out the Space Station flyover.
Register for this webinar today to see how you can use your imagery to gain location insight, use machine learning tools in your applications, and explore advanced object detection from your imagery. The webinar is today from 10-11am.

You may enjoy this interesting series of interactive data visualizations showing land use in the continental United States based on different categorizations used by the US Department of Agriculture. I found it interesting when you organize all the categories together that pasture and rangeland would take up most of the Western US and all of the country’s cities and towns would fit in the Northeast. Check it out!

If your organization is part of the Los Angeles Region Imagery Acquisition Consortium (LAR-IAC), just a reminder there is a LARIAC5 update meeting tomorrow, September 11, 2018 at 9:30am to 12pm. If you plan on attending, make sure to view the meeting webpage and register here: http://go.eagleview.com/lariac-user-group.html .
Also for your reference, here are some important LAR-IAC webpages you should bookmark:
Main LARIAC Page
LARIAC Products and Samples
LARIAC5 Documents and Downloads
Come join LA County on GIS Day, November 14th, from 9am to 3pm at Los Angeles County Grand Park, Olive Court. Learn how LA County departments, and more than 30 other agencies, academic institutions, and private sector companies use GIS to tackle issues affecting the citizens of LA County.
There will be over 50 booths, GIS-enabled emergency vehicles, a map gallery, speakers, GIS games and prizes, and a dunk tank with LA County Supervisors inside … well maybe not the dunk tank! 😉
Attendance is free. For more info, click here.
Orange County has a new Open Data Portal. You can explore by categories, like boundaries, cadaster, environment, health, infrastructure, etc., or just type a search, like “parcels” or “street centerlines”. There are also links to feature apps and paper maps too. Check it out!
For those of you that use ESRI’s ArcGIS Online product, they just announced that they plan on updating it on September 18. Here are four capabilities you can check out once the update happens: Continue reading
