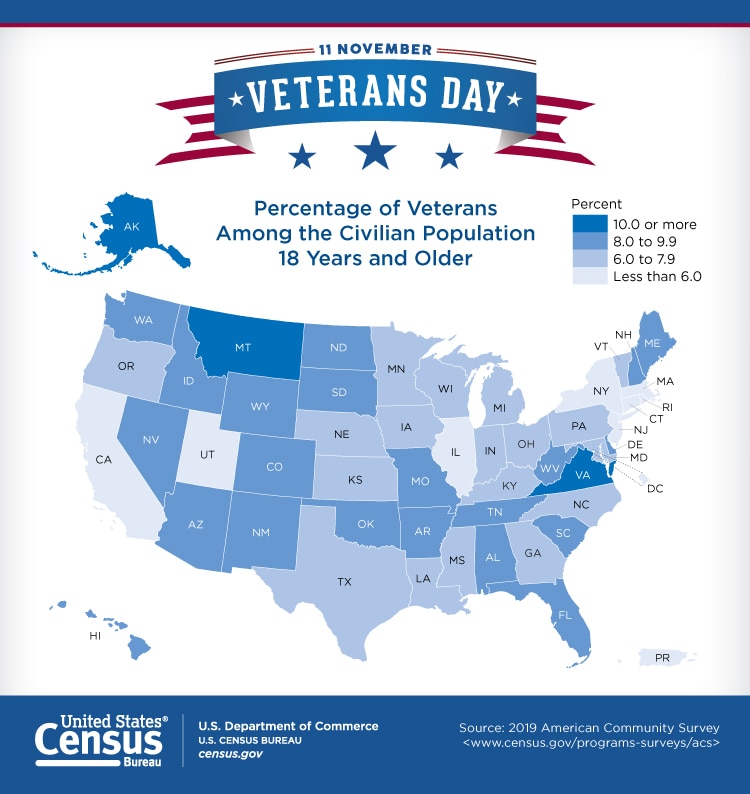
To celebrate Veteran’s day, here is a map from the US Census Bureau showing the percentage of veterans among the civilian population 18 years and older.

To celebrate Veteran’s day, here is a map from the US Census Bureau showing the percentage of veterans among the civilian population 18 years and older.
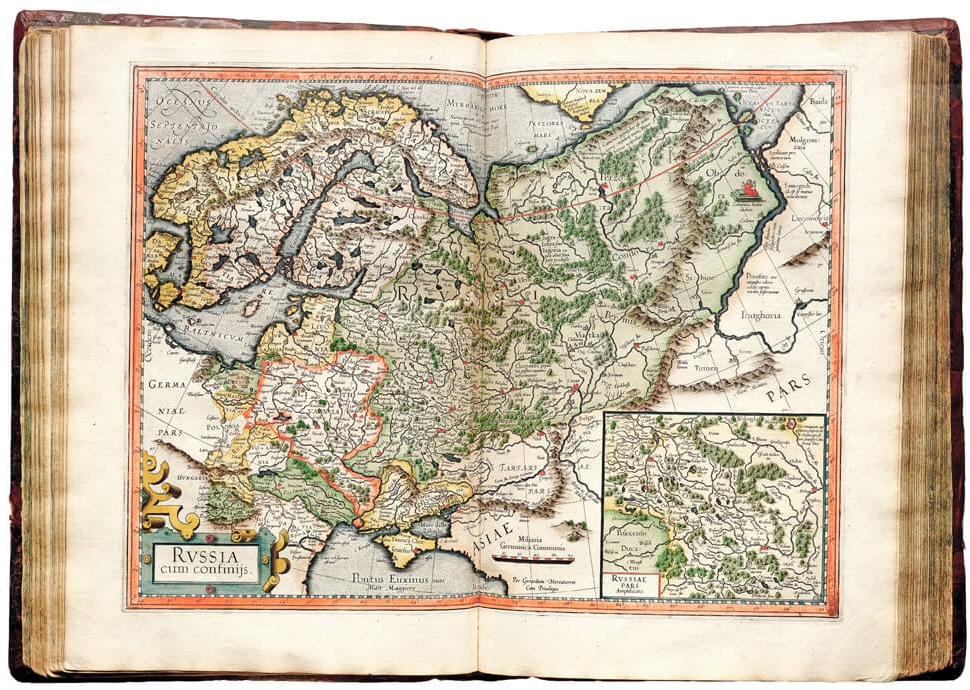
Geographical maps are a mirror of what we know about the world around us. Few individuals contributed more to the map making field than cartographer Gerardus Mercator. Check out this site that examines Mercator’s map making breakthroughs and mistakes, while also recognizing his lasting legacy. We still use Mercator’s projection for making nautical and aeronautical charts!
Since this is Election Day, I thought I would find something on election maps and cartography. I found this article from the New York Times. Politics aside, they do show how you can make a better election map using cartographic and color techniques. Check it out!

Also check out this interesting historical map at the Library of Congress on Presidential Elections from Washington (1789) up to Hayes (1876). Some of the history of the elections on the map are very interesting:
“Disputes arising in February, over the votes of South Carolina, Florida, Louisiana and Oregon, they were referred to, and decided by a Commission appointed for that purpose.”
“The votes of Arkansas and Louisiana were not counted in February, on account of irregularities.”
“Objections made to Wisconsin’s vote in February, were overruled by the Vice-President.”
Click below to see the map in detail.

Now more than ever, state and local governments need to communicate and engage with the public in effective ways. But what makes a civic engagement strategy successful? This webinar will explore the proven technologies and methods that your peers are using to drive effective engagement with their communities. Join the ESRI state and local government team to
Click here to register. Webinar November 18, 2020, 10am.
The Seeger Map Company in Wisconsin will be closing the business by the end of 2020. The first Seeger maps were those drawn for motel guests on scraps of paper in the late 1960s. Eventually, the company would distribute 2 million maps a year, including AAA maps, and employ 27 people in their Racine, Wisconsin offices. Click below to read more about it.

You can still order maps and atlases from their website here.
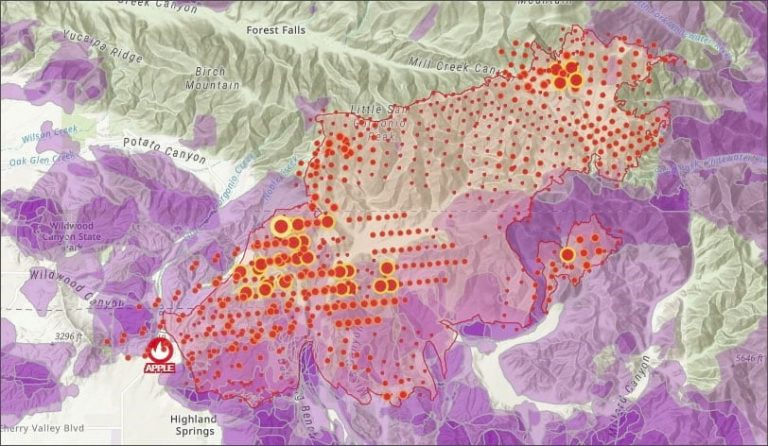
Here is an interesting article from ESRI that shows you how to quickly make a fire map using ArcGIS Online and ArcGIS Living Atlas. Check it out!
If you use Survey123 in your organization, a new update is now available. With this release, Survey123 Connect and the Survey123 web designer will help you create more powerful forms, including ranking questions, choice randomization, and choice filters. You will also be able to more easily create Survey123 report templates. Click below for more info.

Since wind is the topic today through tomorrow in SoCal, check out the Windfinder interactive map. You can move forward and backward in time to see what is forecast for wind in your area.

Have a favorite wind app? Post a comment so others can check it out.
Here is a little light reading for you on Friday! “Network Analysis of Local Food in California: A Study of Farmers’ Markets in Los Angeles and Their Farm Supply Chains“, by Luke Drake, California State University, Northridge.
This study is from The California Geographer, a journal from the California Geographical Society. Check it out!

GIS Day 2020 is about a month away, November 18. For most of us, we will need to do something virtual this year. Check out this ESRI article about making a virtual GIS Day event a success.