ArcGIS Earth 1.0 is ESRI’s newest app that has been marketed as a replacement for users of the soon to be retired Google Earth Enterprise. ArcGIS Earth is a desktop based interactive globe which allows you to visualize and explore 3D and 2D spatial data. ArcGIS Earth software is free.
My goal for this post was not to have a comprehensive review of ArcGIS Earth, but to see how fast I could get it up and running with my data without reading any install or user guide. The less fuss the better.
You first need to download the compressed setup executable from ESRI’s ArcGIS Earth site.
After that, you run the setup executable which wants to “unzip” the needed install files, so pick a directory to place them in. Next, it will start the install which will ask you where to install the software. You can take the default location or place it somewhere else that you like. Once installed, let it start up and you are greeted with a nice globe that spins as it zooms in with a starry background, similar to Google Earth.
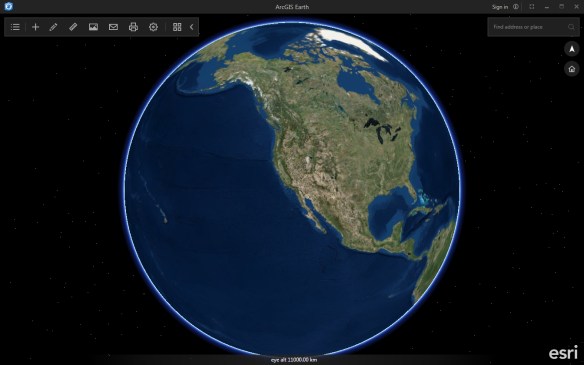
I do like the black framed window with minimal, muted controls that you can hide away.
So I just want to add a shapefile to this puppy. In the upper left on the tool strip I see a “+” icon which I guess is to add data, so I click on it. I was right. Doing so I am presented with public data from ArcGIS Online.

I don’t want that but I see an “Add Files” option as well as an “Enter a URL” option. Cool! I click on “Add Files” and a “Select files” button appears, which I click on and then a file browser window opens for me to select either a .KML, .KMZ, or .SHP file. I select my elevation contours shapefile and the globe zooms to the data.

The first thing I notice is that it is a little slow drawing the data. Maybe too many contour lines? The other thing I notice is that the vector data is being rasterized for the display on the globe. Maybe that is what takes some time? I don’t know, but as you zoom in and out, you see the re-rasterization of the data.

To navigate around, I use my scroll wheel on the mouse to zoom in/out and to pan you left click on the globe and drag it. To tilt the globe, right click and drag as well.

I also find if you double-left click it also zooms in. A double-right click seems to center that location in the window.
I did try my 3D SpaceMouse with ArcGIS Earth, but it only would zoom in and out, no pan or tilt was working. My 3D mouse worked right out of the box with Google Earth and also ArcGlobe, so I think ESRI will need to add the ability to work with other input devices.
I then notice a little blue dot on the list icon in the upper left.

I bet that is telling me I have a layer being drawn on the earth. Clicking on the icon reveals a list of my data.
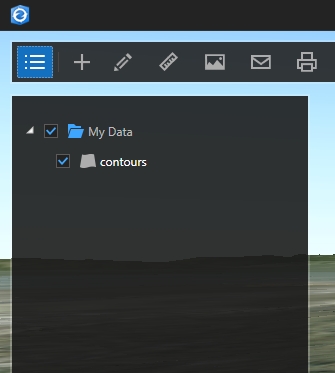
I can turn the layer on or off by clicking on the check box. If I double click on the layer name, the globe zooms to the layer. If I right click on the layer name, I am presented with “Remove” or “Properties”. Selecting “Properties” presents me with a Properties window that allows me to change the symbol type, color, weight, and opacity of the contour lines.
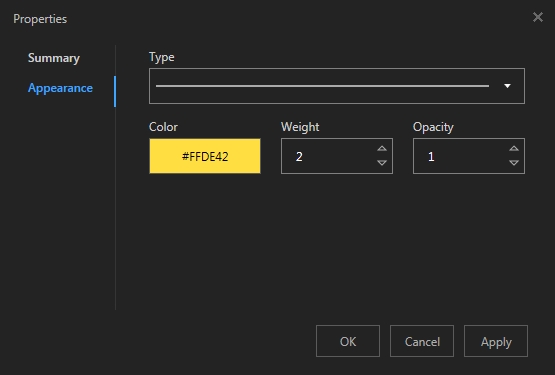
If I click on “Summary” in the Properties menu, it lists the name, feature type, file source, any layer description, and coordinate system. That’s handy!
Now I want to add a KMZ file. I click on the “+” icon and add my fire hazard zones for LA County.
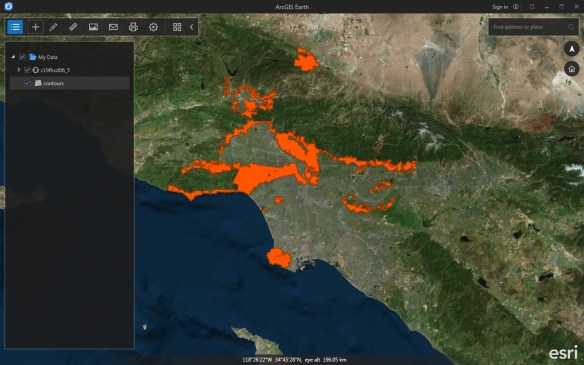
Again the globe zooms to the data and again I notice slowness. Why would this be slow with data on my local drive? Zooming in and out is slow too. Maybe the background basemap is taking a while to stream to ArcGIS Earth?
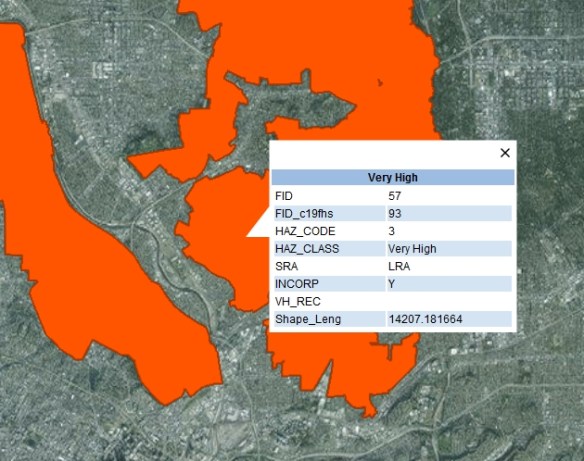
One thing I did not mention is that you can click on any of your features to bring up their attributes. That comes up fast at least.
The last thing I want to do is add one of our ArcGIS Server map services to the globe. Again I click on the “+” icon and this time select “Enter a URL”. Here you can enter the full path to your map service, like ” http://server_name/arcgis/rest/services/layer_name/MapServer “. I added our 2014 orthophotography.
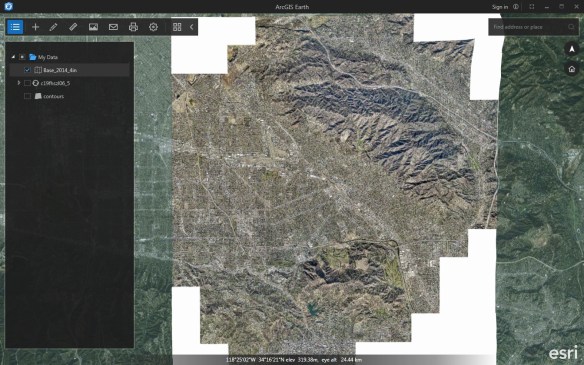
The speed of panning and zooming seem about the same.

Other tools that are available to you are draw tools that allow you to draw points, lines, and polygons; Measure tools for point, line, path, circle, and polygon; Save image to create an image file of your view; Email an image of your view; Print your view; Settings; and Basemap changes.
I do want to mention that under Settings, you can change the startup view to continue where you left off when you open ArcGIS Earth again, and also you can change the default spatial reference from Web Mercator to WGS 84. Other settings include an atmospheric effect, mouse navigation speed (which did not fix my slowness), and an advanced setting for using a proxy server.
One last thing, in the upper right of the window, you can enter an address to zoom to. Also you can reorient your globe to north up by clicking on the north arrow icon and click on the home icon to zoom out to the globe.
Overall ArcGIS Earth is a handy tool to display your KML, shapefile, and map service data on an interactive 3D globe. I would have liked to see it work with data in a geodatabase, but maybe that is for a later release? I did notice that at the top of the interface there was an option to “Sign in” to your ArcGIS Online or Portal accounts. Clicking on it presents a sign in window.

This would then give you access to more data that you have in your ArcGIS Online and/or Portal accounts. Which brings up this observation … I do like the fact that I can use ArcGIS Earth without forcing me to login. I think that was wise on ESRI’s part. Not everyone wants an online account, especially if they only deal with local data. I think this will help the software be more accepted. We will see.
Should you need ArcGIS Earth help, you can find it here.
I do not know why ArcGIS Earth was slow for me. I have a pretty powerful workstation. I found myself becoming very impatient waiting for the globe to keep up with my movements. If it does not get resolved, I don’t see myself using ArcGIS Earth that much. ArcGlobe and the 3D in ArcGIS Pro work a lot faster. Your mileage may vary.
Try ArcGIS Earth out for yourself and see if the tool works out for you. -mike