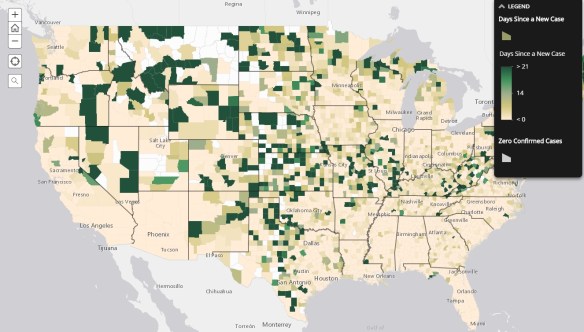
While we slowly open up again, there is that looming possibility of a COVID-19 second wave. Data analysts have been crunching the numbers to see if they can identify any signs of a pending resurgence. Check out this interactive map that shows daily data by US Counties, which include trends, days since last new case, recent outbreaks, active cases per 100,000 people, mortality rate by trend, deaths per 100,000 people, deaths as % of total cases, and state summaries.
Author Archives: socalgovgis - Michael Carson
Webinar: ArcGIS Urban 5 New Features
Check out the 5 new features in ArcGIS Urban 2.0 in a webinar on July 1st. For more info and to sign up, click here.
FOSS4G UK Online June 17
The Open Source Geospatial Foundation’s UK Chapter OSGeo:UK are running a free one day online FOSS4G event on June 17, 2020. This is open to everyone globally. Details at https://uk.osgeo.org/foss4gukonline2020/
You can find a draft program here: https://uk.osgeo.org/foss4gukonline2020/programme.html
Forest Inventory & Analysis Factsheet
If you are interested in exploring forestry statistics in your home state, you might enjoy the Forestry Inventory & Analysis Factsheet. The resource provides “a brief overview of forest resources in each state based on an inventory conducted by the FIA program in cooperation with each State forestry agency.” Factsheets were created using data from the USDA Forest Service’s Forest Inventory and Analysis database. To explore the data, toggle over the map and click on a state, or use the dropdown bar in the lower left-hand corner to select a state from the alphabetized list. Check it out!
Weather Spark
Are you a weather fanatic? If you don’t know about Weather Spark, you should check it out. It is a wonderful website that offers detailed summaries of typical weather anywhere on Earth. From the home page, you are invited to enter a location in the search bar or to choose among major cities, and you can also search via an interactive map (linked below the city list) or view a randomly selected place. Each location in Weather Spark’s database has a vast amount of information concisely presented through colorful graphics and text descriptions, including average temperatures, humidity, solar energy, and much more, with reports available for a yearly, monthly, or daily time frame. You can also compare the average weather for multiple locations simultaneously. Check it out!
2020 ESRI UC Agenda
Security Issue in ArcGIS Enterprise
ESRI has discovered a critical vulnerability in the Portal for ArcGIS component of ArcGIS Enterprise resulting in a Server Side Request Forgery (SSRF) issue when special steps are taken by someone with network access to the ArcGIS Enterprise portal. This can result in access to and control over other infrastructure resources by unauthenticated persons.
For more information and to download a patch, visit the Tech Support page here.
Smart Mapping Capabilities for Time
The date field in ArcGIS Online can be used to visualize data over time, change styling to display temporal differences, track edits, and display a feature’s date and time in a pop-up. The following article provides excellent tips for working effectively with date and time in ArcGIS Online.
Other articles about using time:
Get A Free ArcGIS Pro License
8/5/2020 UPDATE: This program has been extended through December 31.
ESRI has announced that it will provide free access to its ArcGIS platform and learning resources through the Learn.ArcGIS.com website to support college students during the COVID-19 outbreak.
Those who register between March 1 and June 30 will have free access to an ArcGIS Pro 2.5 license until August 31, 2020.
To register as a member of Learn ArcGIS you can do so via the following link:
https://learn.arcgis.com/en/become-a-member/
To download and install ArcGIS Pro 2.5 go to:
https://learn.arcgis.com/en/arcgis-pro-for-learn-members/
Once installed, open ArcGIS Pro and sign in with your username and password.


